
Figure 4.
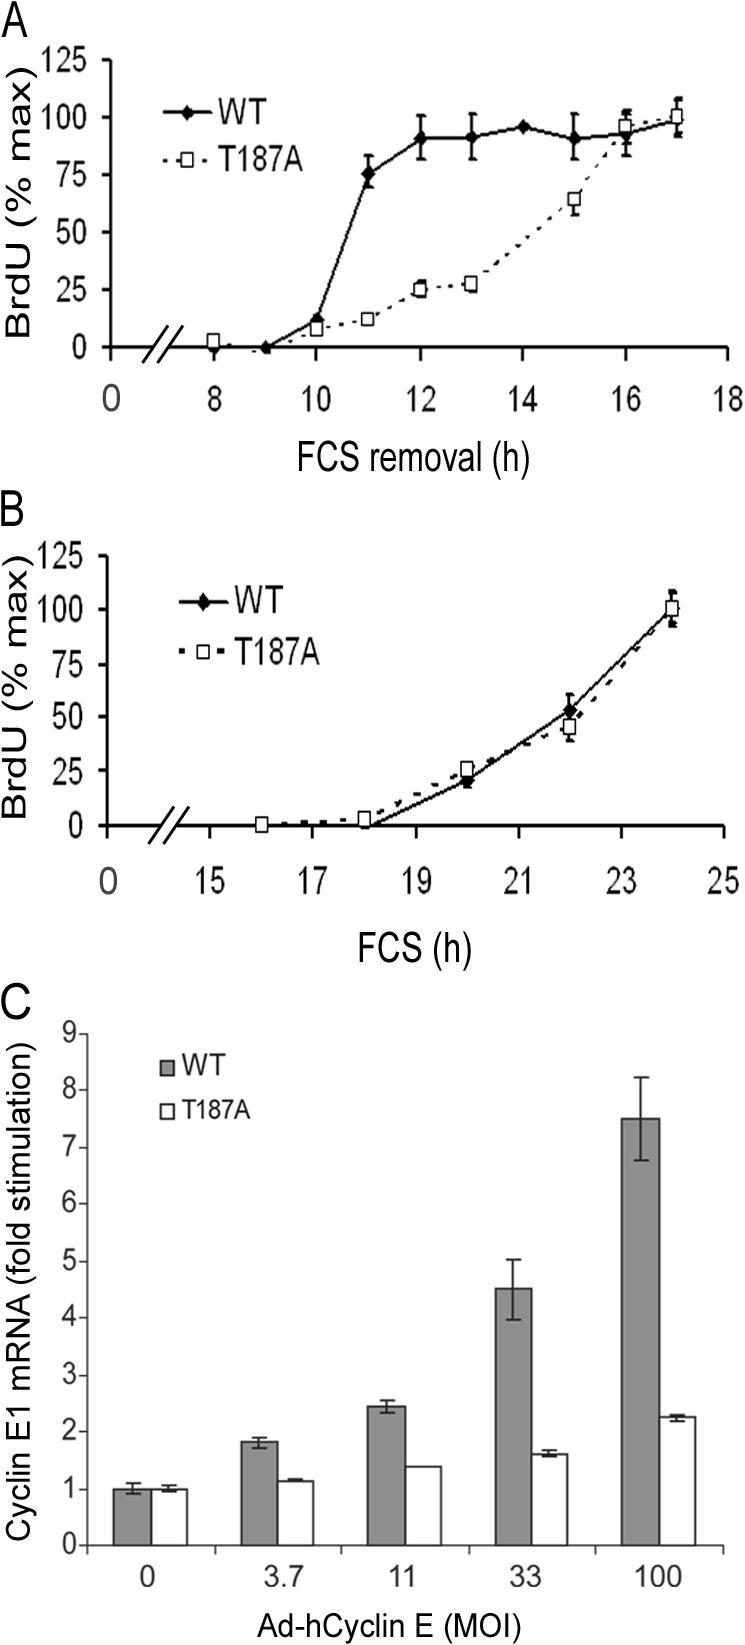
The Skp2 autoinduction loop controls the restriction point. (A) Restriction point analysis in wild-type (WT) and p27T187A (T187A) MEFs. Results are plotted relative to the BrdU incorporation observed at the last time point (34 and 39% for wild type and p27T187A MEFs, respectively). (B) S phase entry in wild-type and p27T187A MEFs continuously incubated with 10% FCS and BrdU. Results are plotted relative to the BrdU incorporation observed at the last time point (44 and 48% for wild-type and p27T187A MEFs, respectively). (C) Serum-starved wild-type (WT) and p27T187A (T187A) MEFs were infected with increasing (3.7–100) MOI of Ad–hCyclin E or 100 MOI Ad-LacZ (shown as 0 MOI Ad–hCyclin E). The level of mouse cyclin E1 mRNA was determined by QPCR (using a primer-probe set that recognizes mouse, but not human, cyclin E1 mRNA) and plotted relative to its level in the Ad-LacZ–infected cells. Error bars show mean ± SD.