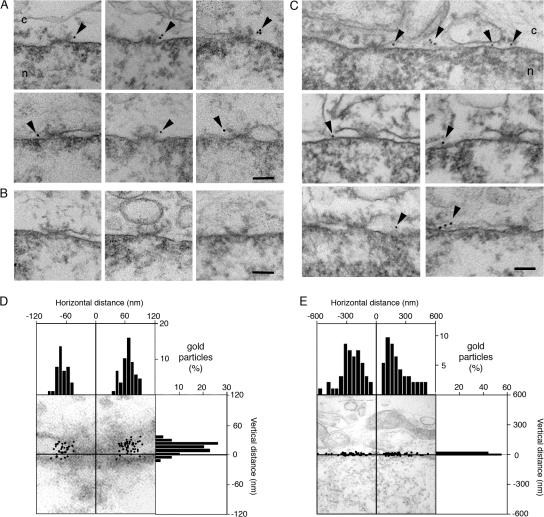
Figure 3.
Sun1 but not Sun2 is closely associated with NPCs as revealed by immunoelectron microscopy. (A) Views of NPC cross sections from tetracycline-induced HeLa cells expressing Sun1-GFP that reveal anti-GFP–associated gold particles close to NPCs. (B) Sections of uninduced cells display little or no gold labeling. (C) Images of NE cross sections from HeLa cells expressing Sun2-GFP reveal gold particles in the PNS but with no preferential association with NPCs. c, cytoplasm; n, nucleus. Arrowheads indicate gold particles. (D and E) Quantitative analysis of the distribution of gold particles from NE cross sections of HeLa cells expressing Sun1- (D) or Sun2-GFP (E). The position of gold particles, which is defined by horizontal distance (from the NPC eightfold axis) and vertical distance (from the central plane of the NE), was measured in cross sectioned NEs (as in A and C) and plotted in a single dot graphic. Micrographs are provided as a visual reference for the position of the gold particles. Histograms for the distribution of gold particles for horizontal and vertical distances are shown on adjacent panels. For both Sun1 and 2, gold particles were scored within 200- and 600-nm windows on either side of each NPC. The larger, more conservative window size still reveals an absolute eightfold higher labeling density of Sun1 over Sun2 within 120 nm of the NPC center, with a peak density at 66 nm. A total of 88 and 92 gold particles were scored for D and E, respectively. Because of the far broader distribution of Sun2-GFP, the scale in E is five times that in D. Bars, 100 nm.

