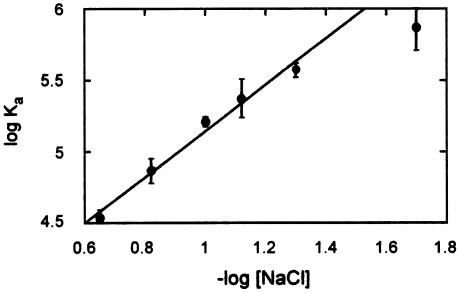
Figure 4.
The ionic strength dependence of neomycin B binding to TAR-2′pyr(25). The linear fit shown, with a slope of 1.61, does not include the point at 20 mM NaCl. As mentioned in the text, significant aggregation is sometimes observed at this low salt concentration, affecting the measured Ka. The line indicates a least-squares linear fit. Error bars indicate the standard deviation of at least three independent measurements at each NaCl concentration.

