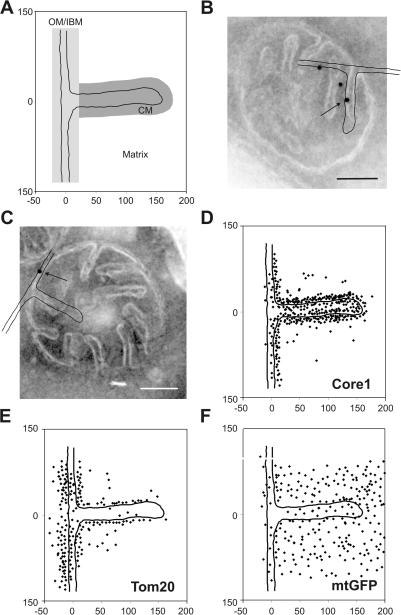
Figure 1.
Localization of mitochondrial proteins by immuno-EM and in silico accumulation of gold particles onto an empiric model. S. cerevisiae wild-type (D273-10B) or matrix-targeted GFP-expressing cells were grown to early log phase in liquid complete media containing 2% lactate, chemically fixed, cryosectioned, and immunogold labeled. The location of gold particles found in mitochondria showing clearly resolvable CMs connected by cristae junctions to the IBM were plotted onto a single, empirically determined, drawn to scale model (see Materials and methods). (A) Model representing part of OM, IBM, CM, and matrix. The zones were defined as follows: OM/IBM, the center of a gold particle is ≤14 nm from the OM or IBM; CM, the center of a gold particle is ≤14 nm in distance from the CM and not in the OM/IBM zone; background, the center of a gold particle is neither in the OM/IBM nor the CM zone. Assignment to the matrix was done for gold particles that are in the background zone located on the matrix side of the inner membrane. (B and C) Exemplary alignment of the model with mitochondria that were immunogold labeled for Core1 or Tom20, respectively. Arrow points to gold particle plotted onto model shown. (D–F) Graphical representations of the distribution of Core1, Tom20, and mtGFP. Numbers at x and y axes represent distances in nanometers. Bars, 100 nm.

