Figure 7.
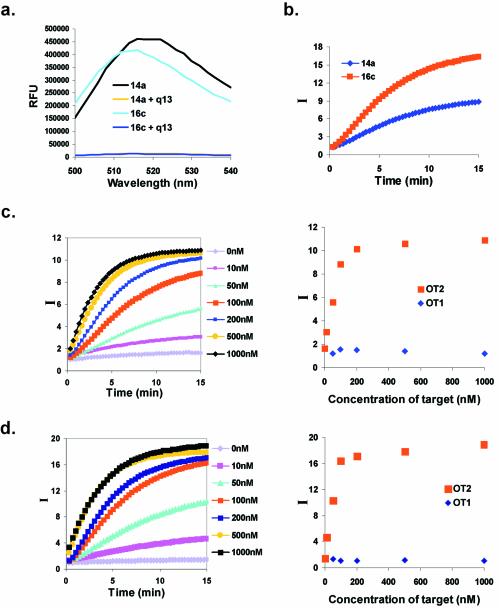
Fluorescence responsivities of selected beacons. (a) Fluorescence quenching in the presence of the capture oligonucleotide. The capture oligonucleotide q13 was present in a 2:1 (100:50 nM) molar excess to beacons 14a or 16c. (b) Target-dependent increase in fluorescence. Complexes with the capture oligonucleotide were formed as in (a), the target oligonucleotide OT2 was added in 2-fold excess, and the time-dependent development of the signal was monitored. (c) Concentration-dependent response of beacon 14a to target oligonucleotide OT2. I is the signal-to-background ratio, as defined in Materials and Methods. These data are also shown as a function of concentration, rather than time, for the t = 15 min time point. (d) Concentration-dependent response of beacon 16c to target oligonucleotide OT2. These data are also shown as a function of concentration for the t = 15 min time point.

