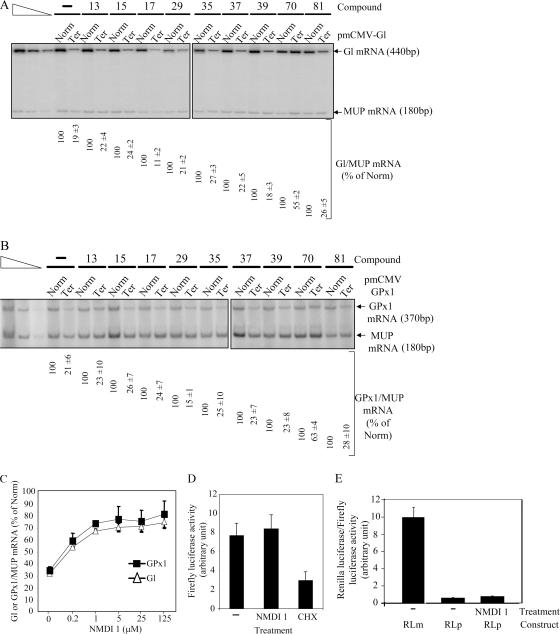
Figure 1.
Identification of an NMD inhibitor. (A) RT-PCR analysis of globin and MUP mRNA. 106 HeLa cells were transfected with a plasmid that codes for MUP mRNA and with test and reference plasmids that code for globin mRNA wild type (Norm) or harbor a PTC (Ter). After transfection, cells were incubated with DMSO(−) or 5 μM of a chemical compound for 20 h. Purified RNA was reverse-transcribed to serve as a substrate for specific amplification by PCR. The three leftmost lanes correspond to serial twofold dilutions of PCR template to ensure that the amplification conditions are quantitative. (B) RT-PCR analysis of GPx1 mRNA wild type (Norm) or cells harboring a PTC (Ter). The experiment was performed as described in A. The measure of the level of Gl or GPx1 mRNA was normalized with the level of MUP mRNA. The level of each Gl or GPx1 Ter was normalized with the level of the corresponding Gl or GPx1 Norm and is reported as a percentage of Norm (number below each lane). (C) Dose-response effect of NMDI 1 on Gl or GPx1 Ter. Hela cells were transfected with pmCMV-Gl Ter or pmCMV-GPx1 Ter and with phCMV-MUP. After 24 h, cells were incubated with an increasing amount of NMDI 1. NMD was measured by quantitative radiolabeled RT-PCR and confirmed by RPA. (D) Measure of Fluc activity. Cells were transfected with pRLuc and pFluc expression vectors, and then treated with DMSO(−), NMDI 1, or CHX. Fluc activity was measured by a luminometer and normalized according to the expression level of Fluc and Rluc mRNA. (E) NMDI 1 does not inhibit miRNA-induced mRNA decay. HeLa cells were transfected with either pRL-3XBulgeMut (RLm) or pRL-Perf (RLp; Pillai et al., 2005) and incubated for 24 h with DMSO(−) or NMDI 1. Histogram represents the ratio of Rluc/Fluc. Results were normalized to RLm, which was set at 10 arbitrary units. All results are representative of at least three independent experiments. Error bar denotes SD.

