Figure 2.
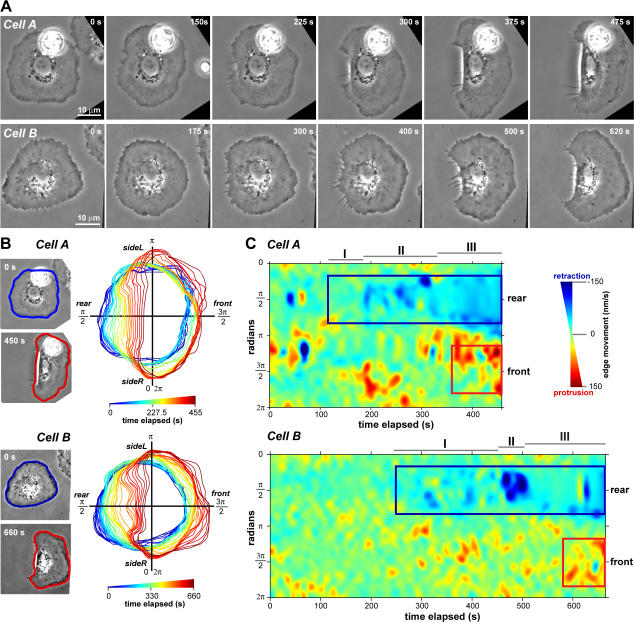
The prospective rear edge moves before the front edge during motility initiation. (A) Phase-contrast image sequence of two representative keratocytes breaking symmetry and initiating motility. (B, left) Cell outline superimposed on the first and last image in the image sequence for the same cells as in A. (B, right) Time sequence of the cell outline during motility initiation, with color denoting time elapsed (in seconds). (C) Protrusion/retraction map of the cell edge (in polar coordinates) over time. Blue boxes are regions of continuous rear retraction. Red boxes are regions of continuous front protrusion. The rear of the cell exhibited three phases during motility initiation: I, slow rear retraction; II, fast rear retraction; and III, persistent movement. A is available as Videos 3 and 4 (available at http://www.jcb.org/cgi/content/full/jcb.200706012/DC1).

