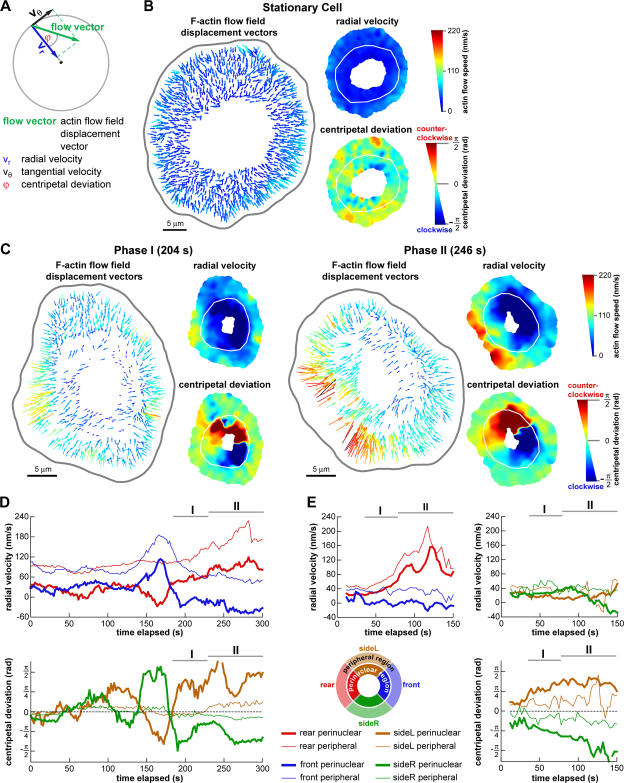
Figure 3.
Initial events in symmetry breaking include an increase in F-actin network flow speed at the prospective cell rear and a reorientation of perinuclear F-actin network flow. (A) Representation of an F-actin flow field displacement vector by its radial (vr) and tangential (vθ) component. The centripetal deviation (φ) was positive for counter-clockwise rotation and negative for clockwise rotation of the original flow vector relative to vr. (B and C) F-actin flow field of a stationary cell (B) and a cell initiating motility (C) with the prospective direction of cell movement to the right. (left) F-actin network flow field; flow vectors are colored according to speed. (right) Scalar maps of radial velocity and centripetal deviation of F-actin flow vectors. White line is the delineation of the perinuclear and peripheral regions. (C, left) Phase I: the radial velocity increased slightly at the prospective cell rear. The magnitude of the centripetal deviation increased in the perinuclear region, corresponding to a reorientation of the F-actin flow along the prospective direction of motion. (right) Phase II: large increase in radial velocity at the prospective cell rear. The increased magnitude of centripetal deviation remained. (D and E, top) Time courses of radial velocity in the front (blue), rear (red), left (brown), and right (green) perinuclear (bold) and peripheral (standard) regions. Data in D originate from the cell in C and showed large transients before sustained polarization. (bottom) Time courses of centripetal deviation in the left (brown) and right (green) perinuclear (bold) and peripheral (standard) regions. Phases I and II are indicated by horizontal bars. B and C are available as Videos 5 and 6 (available at http://www.jcb.org/cgi/content/full/jcb.200706012/DC1).

