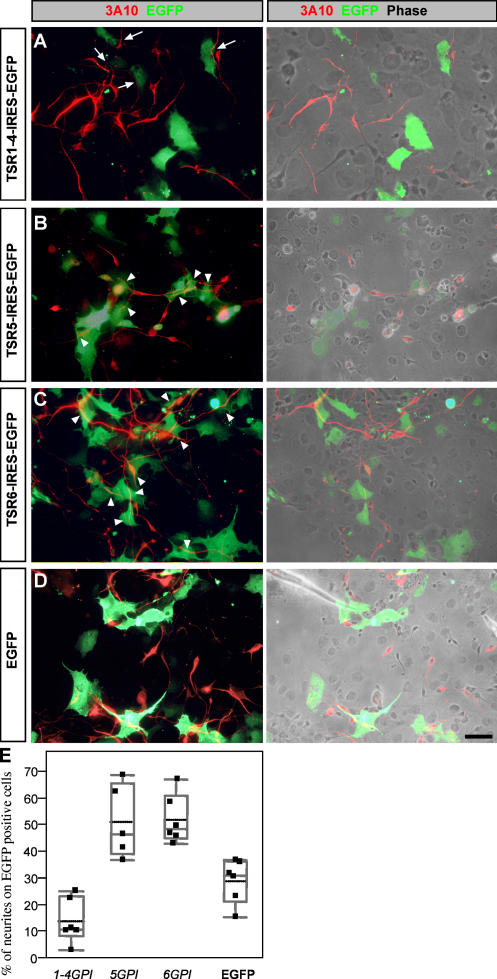
Figure 1.
Differential outgrowth activity of TRSs of F-spondin. COS cells were transfected with pCAGG–TSR1-4GPI–IRES–EGFP (A), pCAGG–TSR5GPI–IRES–EGFP (B), pCAGG–TSR6GPI–IRES–EGFP (C), and pCAGG–EGFP (D). Dissociated E6 chick dorsal spinal cord was plated 24 h after transfection and cultured for an additional 48 h. Neurites are detected with 3A10 mAb. Fluorescence images are shown in the left, and combination of fluorescence and phase contrast images are shown in the right. Neurites are deflected from TSR1-4GPI–expressing cells (A, arrows) and grow preferentially on the adjacent nonexpressing cells. Neurites grow preferentially on TSR5GPI (B)- and TSR6GPI (C)-expressing cells (arrowheads) rather than on the neighboring nonexpressing cells. In the control experiment neurites grow uniformly on EGFP-expressing and nonexpressing cells (D). For quantification, images (n = 6 for each experiment) of the cultures were taken with a digital camera. The total neurite outgrowth was measured as a 3A10-positive area using ImageJ software. A total of 146 neurites were analyzed for TSR5GPI, 278 for TSR6GPI, 203 for TSR1-4GPI, and 455 for EGFP. The area occupied by neurites growing on EGFP-expressing cells was measured using the RG2B colocalization plugin of ImageJ software. The ratio between neurites extending on expressing cells versus total outgrowth is presented. Comparing each experimental group to the control using Dunnett's method (which takes into account multiple comparisons) shows a significant difference between the TSR5GPI (P = 0.004), TSR6GPI (P = 0.002), and TSR1-4GPI (P = 0.04) groups and the control EGFP group. Bar, 10 μm.

