Figure 5.
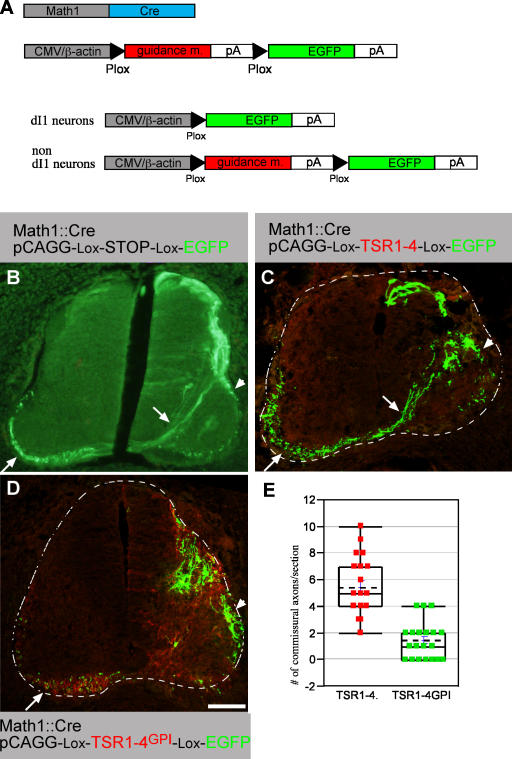
Membrane-tethered TSR1-4 inhibits commissural outgrowth in vivo. (A, top) Two plasmids are coelectroporated into the chick neural tube. Math1 enhancer, which drives expression in the dI1 dorsal interneurons (Helms and Johnson, 1998), was used to drive expression of Cre recombinase and an alternate guidance molecule/EGFP plasmid. This plasmid contains a CMV enhancer followed by a guidance molecule (F-spondin or ApoER2) flanked with two Plox sites, followed by EGFP. (A, bottom) On electroporation into the chick spinal cord, the guidance molecule will be excised in dI1 cells that express Cre, leading to EGFP expression, whereas nondI1 cells present along the dI1 axonal pathway will express the guidance molecule. EGFP (B), TSR1-4 (C), and TSR1-4GPI (D) were electroporated using an EGFP alternating cassette along with a Math1-Cre plasmid. An alternating cassette contains a Plox-TSR-Plox-EGFP cloned in pCAGG vector. Electroporation was performed at stages 17–18 and embryos were analyzed with anti-myc (Cy3) and anti-EGFP (Cy2) antibodies at stage 26. (B) Expression of EGFP in dI1 cells. dI1 neurons project their axon toward and across the floor plate (arrow) and ipsilaterally (arrowhead). Commissural axons projecting diagonally toward the floor plate and across it to the contralateral side are observed (arrow). (C) dI1 EGFP-expressing cells are present at the dorsal, dorsal-lateral, and medial-lateral spinal cord. Commissural axons projecting diagonally toward the floor plate and across it to the contralateral side are observed (arrow). In addition, the medial-lateral dI1 subpopulation projects ipsilaterally (arrowhead). (D) Very few axons are extending diagonally toward the floor plate at the TSR1-4GPI domain (myc epitope in red). EGFP-expressing axons and TSR1-4GPI–expressing axons projecting longitudinally at the contralateral side are evident (arrow). (E) Quantification of the extent of commissural projection in B and C. Sections from four different embryos (for each group) with matching EGFP intensity were selected. 25 sections of the TSR1-4GPI and 20 sections of the TSR1-4 were analyzed. The number of diagonally crossing axons toward the floor plate was scored. Using a t test shows a significant difference between the TSR1-4 and TSR1-4GPI groups, under a significant level of α = 0.05. The dashed lines demarcate the spinal cord. The image in A was taken with a microscope using a digital camera. Images in C and D were taken with a confocal microscope. Bar, 100 μm.

