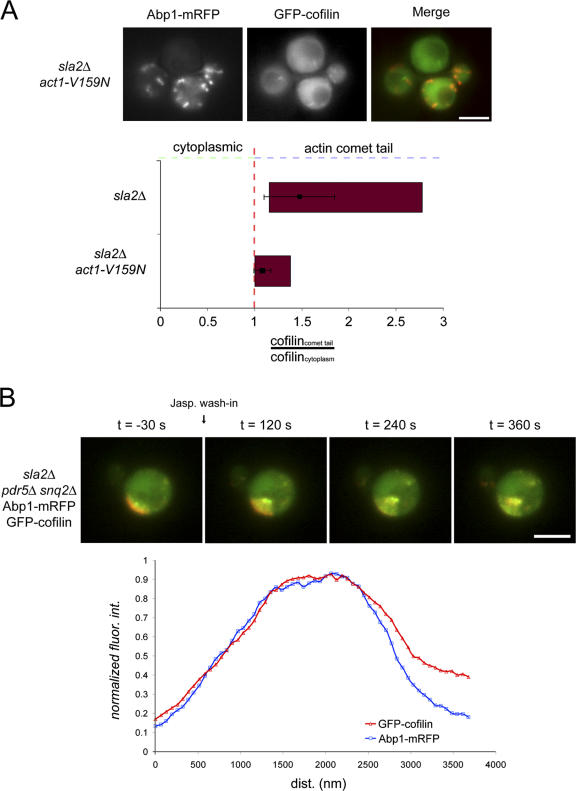
Figure 2.
Actin nucleotide state controls cofilin association with F-actin structures in vivo. (A) GFP-cofilin and Abp1-mRFP localization in sla2Δ act1-V159N cells was captured by simultaneous two-color imaging. The ratio of the fluorescence intensity of GFP-cofilin in actin tails and in the cytoplasm was quantified in 28 cells for sla2Δ mutants and act1-V159N sla2Δ mutant cells. The data are presented as range bar graphs in red, where the range of the entire dataset from minimum to maximum is given. Means of the data (black squares) with standard deviations (error bars) are overlaid on the range bar graphs. (B) The redistribution of GFP-cofilin localization within actin comet tails labeled by Abp1-mRFP in sla2Δ pdr5Δ snq2Δ cells upon treatment with jasplakinolide at t = 0 s. Cells were immobilized in a flow chamber (see Materials and methods), and 50 μM jasplakinolide was flowed through the chamber while simultaneously imaging both fluorophores. Single frames from the time-lapse analysis at the given time points are shown. Quantification of the normalized fluorescence intensities as a function of length along the actin tail for five cells (three measurements per tail) 5 min after treatment with jasplakinolide is presented in the graph. Bars, 4 μm.

