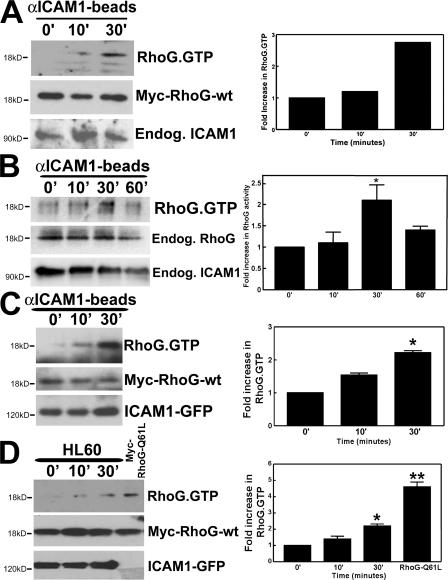
Figure 6.
RhoG is activated downstream from ICAM1. (A) HUVECs were transiently transduced with myc-RhoG-wt using adenovirus. αICAM1 beads were added as described in Materials and methods. Using GST-ELMO, activated RhoG was pulled down from the lysate and detected by Western blot analysis using anti-myc antibodies. The middle blot shows protein expression levels of myc-RhoG-wt in endothelial cell lysates. The graph on the right shows quantification of two independent experiments. (B) αICAM1 beads were added to TNF-α–stimulated endothelial cells as described in Materials and methods. Using GST-ELMO, activated endogenous RhoG was isolated and detected by Western blot analysis using anti-RhoG mAbs. (A and B) αICAM1 beads increased RhoG activity in endothelial cells within 30 min (top). The bottom panel shows endogenous ICAM1 expression in endothelial cell lysates. (B) The middle panel shows expression levels of endogenous RhoG in endothelial cell lysates. (C) COS7 cells were transiently transfected with myc-RhoG-wt and ICAM1-GFP. αICAM1 beads were added as described in Materials and methods. Using GST-ELMO, activated RhoG was isolated and detected by Western blot analysis using anti-myc antibodies. αICAM1 beads increased RhoG activity up to 30 min (top). The middle panel shows expression levels of myc-RhoG-wt in cell lysates. The bottom panel shows ICAM1-GFP expression detected by anti-GFP antibodies in cell lysates. (D) Experiments were performed as in B, but with HL60 cells (5 × 10⁵ cells per six wells). Single-transfected myc-RhoG-Q61L-COS7 cells were used as a positive control. The top panel shows that HL60 cell adhesion increased RhoG-GTP levels. The middle panel shows levels of transfected myc-RhoG-wt, and the bottom panel shows levels of ICAM1-GFP. (B–D) The graph on the right shows quantification of three independent experiments. Data are means ± SEM (error bars). *, P < 0.05; **, P < 0.01.

