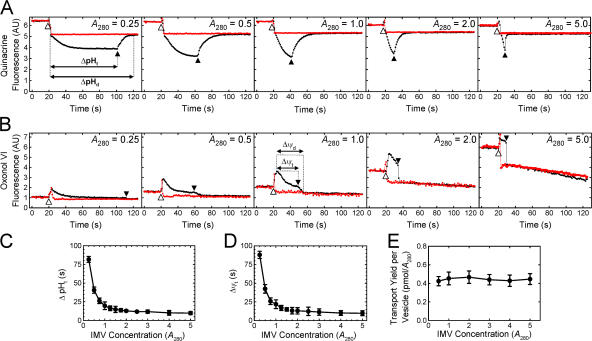
Figure 4.
Duration of the detectable PMF and its effect on pre-SufI transport yield. (A) ΔpHt dependence on the IMV concentration. ΔpH generation was measured by quinacrine fluorescence in the presence (red) and absence (black) of 10 μM nigericin at the indicated IMV concentrations. The time span between NADH (4 mM) addition (20 s time point; identified by the open arrowhead) and the time at which the next inflection point occurred (identified by the filled arrowhead), presumably the point at which the solution became anaerobic, was termed the ΔpHt. The time span between NADH addition and the time at which the detectable gradient ceased to exist was termed the ΔpHd. (B) Δψt dependence on the IMV concentration. Δψ generation was measured by oxonol VI fluorescence in the presence (red) and absence (black) of 10 μM nigericin and 10 μM valinomycin at the indicated IMV concentrations. Δψt and Δψd were defined similarly to ΔpHt and ΔpHd in (A), respectively, as indicated. (C) Mean ΔpHt plotted against the IMV concentration (n = 3). (D) Mean Δψt plotted against the IMV concentration (n = 3). (E) Dependence of transport yield per vesicle on vesicle concentration. Transport yield per vesicle was measured at a high pre-SufI concentration (250 nM) at various IMV concentrations (n = 3). A measure of the transport yield per vesicle was obtained by dividing the transport yield (pmol pre-SufI) by the IMV concentration (A 280). Though not the actual transport yield per vesicle, these values are expected to be directly proportional to the true values.

