
Figure 1.
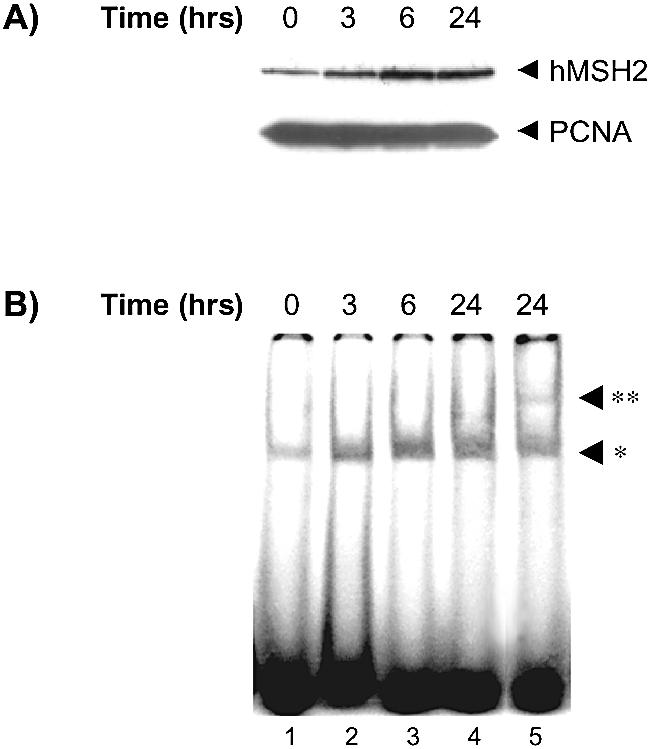
Kinetics of induction of hMSH2 expression and binding activity through TPA activation. U937 cells were TPA-treated (50 nM) for various times (0, 3, 6 and 24 h, as indicated) and protein extracts were prepared for the following two sets of experiments. (A) On the top panel, hMSH2 expression was observed as a 105 kDa band, by western blot analysis with 30 µg of extracts. On the bottom panel, detection of the PCNA protein (36 kDa) serves as a loading control. Immunoreactive proteins were detected as described in Materials and Methods. (B) Binding activity of the hMSH2-hMSH6 complex was evaluated on a 34mer duplex containing a TG mispair (lanes 1–4) with 30 µg of extracts. Supershift assays were performed incubating hMSH6-antibodies with the 24-h treated cell extracts (lane 5). The single and double asterisks designate the positions of the bound oligonucleotides and the supershift complex respectively.