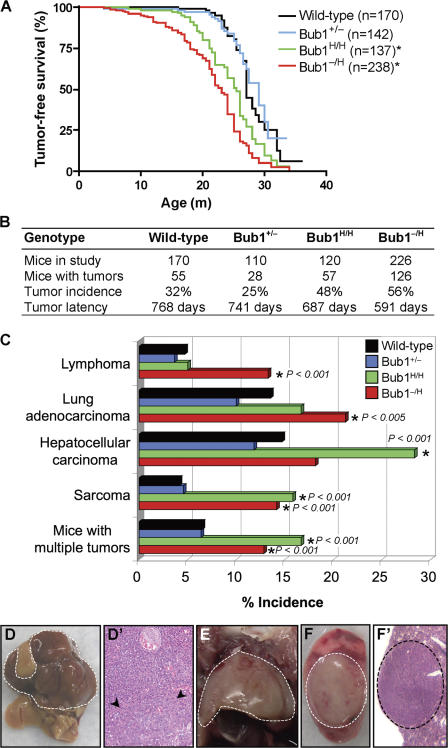
Figure 6.
Bub1−/H and Bub1H/H mice are prone to spontaneous tumors. (A) Tumor-free survival curves of Bub1+/+, Bub1+/−, Bub1H/H, and Bub1−/H mice. The asterisks mark curves that are significantly different from wild-type using a logrank test (P < 0.0001). We note that the tumor-free survival of a small cohort of Bub1+/H mice (n = 10) was similar to that of Bub1+/+ mice (not depicted). Furthermore, the median tumor-free survival of Bub1−/H mice was significantly shorter than that of Bub1H/H mice (P < 0.01). (B) Spontaneous tumor incidence and tumor latency of Bub1+/+, Bub1+/−, Bub1H/H, and Bub1−/H mice. (C) Tumor spectrum of Bub1+/+, Bub1+/−, Bub1H/H, and Bub1−/H mice. Asterisks mark values that are significantly different from wild type using a Fisher exact Chi-square test. (D) An overt hepatocellular carcinoma is indicated by the dashed line. (D′) Hematoxylin and eosin stained well-differentiated hepatocellular carcinoma, showing a proliferation of mildly atypical hepatocytes with abundant vascular channels, a lack of normal portal tracts, and a nodular focus (arrowheads) with mildly thickened trabeculae. (E) Thymic lymphoma (dashed line). (F) Overt lung adenocarcinoma (dashed circle). (F′) Hematoxylin and eosin–stained low-power magnification of a typical lung adenocarcinoma (dashed circle).

