Figure 1.
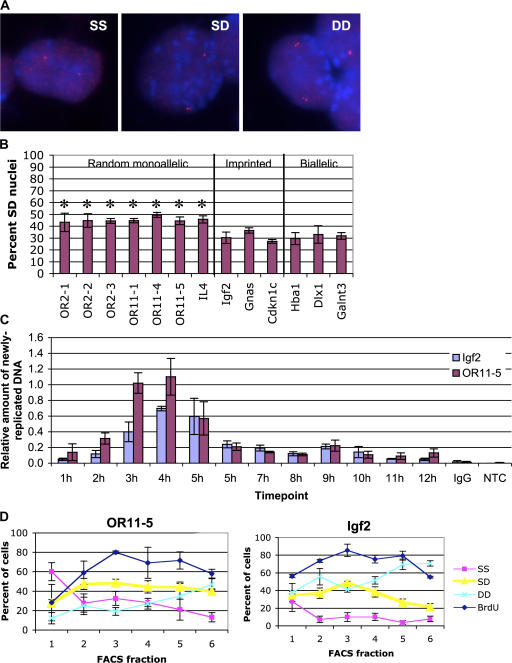
Autosomal random monoallelic genes display SIAR. (A) Representative FISH images of cells displaying SS, SD, or DD signals. DNA-FISH was performed on wild-type ES cells using the OR probe OR11-5 (Table I) labeled with Cy3 (red). DNA was stained with DAPI (blue). OR probes tended to show a relatively high nonspecific background signal by FISH, probably due to cross-hybridization with other OR genes. (B) Quantitation of the percentage of nuclei displaying SD FISH signals for the random monoallelic OR and IL-4 loci; the imprinted genes Igf2, Gnas, and Cdkn1c; and the biallellically expressed genes Hba1, Dlx1, and Galnt3. Asterisks indicate samples with a significantly greater % SD than Hba1 using an unpaired t test (P ≤ 0.001). Error bars represent one standard deviation in each direction. See Fig. S1 for complete scoring of SS, SD, and DD signals (available at http://www.jcb.org/cgi/content/full/jcb.200706053/DC1). (C) Replication timing assay. Cells were arrested in G1 with mimosine, and released. At 1-h intervals, cells were BrdU labeled, DNA was isolated, and BrdU-containing DNA was immunoprecipitated. Sequences from OR11-5 (specifically, the OR gene Olfr464), Igf2, and a loading control, consisting of BrdU-labeled human DNA added before immunoprecipitation, were analyzed by quantitative PCR amplification. Water (no template control, NTC) and DNA immunoprecipitated with nonspecific serum (IgG) were amplified as negative controls. PCR primer sequences are given in Table II. (D) Percentage of nuclei with SD FISH signals in FACS fractions. DNA was stained with Hoeschst, and cells were sorted (Fig. S1) by DNA content onto slides. FISH was performed on PFA-fixed cells using probes to the OR array OR11-5 and the imprinted gene Igf2. Percent BrdU positive (blue diamonds), singlet/singlet (SS; pink squares), singlet/doublet (SD; yellow triangles), and doublet/doublet (DD; aqua crosses) cells are shown. Both OR11-5 and Igf2 showed the expected decrease in the percentage of SS cells in the early fractions and the expected increase in DD signals in later fractions. Error bars represent one standard deviation in each direction. For Igf2, the fraction of SD cells in fraction 3 was significantly higher than in fractions 1, 5, and 6 (P ≤ 0.001) and somewhat higher than in fractions 2 and 4 (P < 0.05) based on a t test. For OR11-5, the frequency of SD cells was significantly lower in fraction 1 (P < 0.005) than in the remainder of the fractions.

