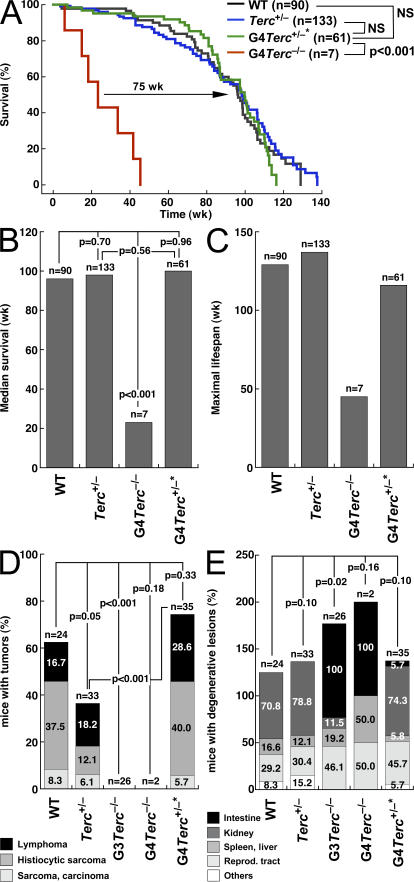
Figure 7.
Rescue of organismal life span in late generation telomerase-reconstituted G3 Terc+/−* mice. (A) Kaplan-Meyer survival curve of mice of the indicated genotype. n is the number of mice of each genotype. Statistical comparisons using the log rank test are also shown. Note the significant rescue in survival of telomerase-reconstituted G3 Terc +/−* mice compared with G3 Terc −/− mice (P < 0.001). (B) Median survival obtained from Kaplan-Meyer plots of mice of the indicated genotypes. Statistical comparisons using the log rank test are also shown. Note the significantly reduced median survival of G3 Terc −/− mice compared with the other genotypes (P < 0.001). (C) Maximal lifespan of mice of the indicated genotypes. Note the decreased maximal life span of G3 Terc −/− mice and how this is corrected in telomerase-reconstituted G3 Terc +/−* mice. (D) Percentage of mice of the indicated genotype showing malignant tumors (lymphoma, histiocytic sarcoma, or sarcoma/carcinoma) at the time of death. Statistical comparisons using the χ2 test are also shown. Note the decreased incidence of malignant tumors in G3 and G4 Terc −/− mice in agreement with a tumor-suppressor role associated with telomerase deficiency and short telomeres. Telomerase-reconstituted G4 Terc +/−* mice show a similar tumor incidence to that of wild-type controls. (E) Percentage of mice of the indicated genotype showing degenerative pathologies (atrophies) in the indicated tissues at the time of death. Statistical comparisons using the χ2 test are also shown. Note the decreased incidence of intestinal atrophies in telomerase-reconstituted G4 Terc +/−* mice compared with G3 and G4 Terc −/− mice.

