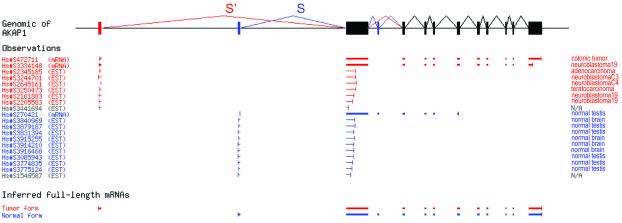
Figure 1.
Detection of cancer-specific alternative splicing in AKAP1. Raw data showing the schematic alignment of all 17 ESTs aligning to the S/S′ region of the gene structure (including two ESTs of unclassified origin, excluded from our calculation) and 3 mRNAs. In normal tissues, splice form S was strongly preferred (9/9 ESTs and 1/1 mRNA), but in tumors, splice form S′ replaced it entirely (6/6 ESTs and 2/2 mRNA). The odds ratio for the null hypothesis that no shift from S to S′ occurs between normal and tumor samples is less than 10–4. The UniGene sequence identifier is shown for each sequence.

