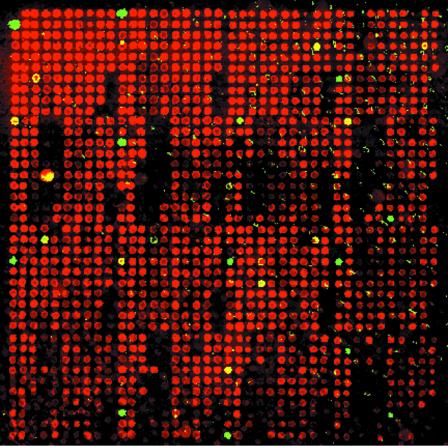
Figure 4.
Microarray image for 1536 pea DNA samples assayed for the 1794-1 allele under the same conditions as Figure 2b. Red (Cy5) spots indicate samples containing an unoccupied (–) allele, green indicates occupied (+) and yellow indicates both alleles (+/–). Each PCR was spotted once per array.

