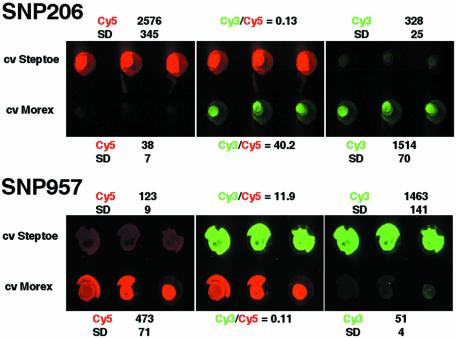
Figure 5.
Detection of barley SNP polymorphisms using the tagged microarray approach. Cultivars Steptoe and Morex have contrasting alleles for SNP 206 and SNP 957. Cy5 fluorescence indicates the presence of one allele and Cy3 the other. Samples were spotted in triplicate. The Cy3 (green) and Cy5 (red) colour-separated images and the two-colour (overlay) image are shown. Quantification of averaged array intensities (in arbitrary fluorescence units) and the Cy3/Cy5 ratios of signal intensities are also shown. SD, standard deviation.

