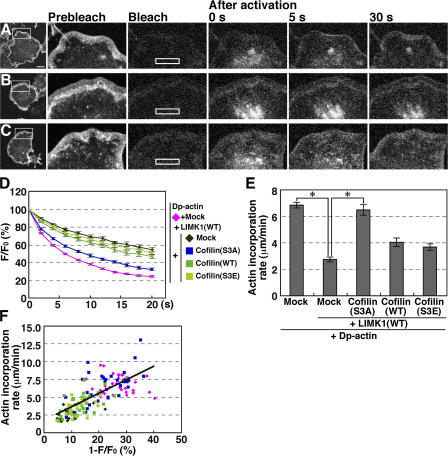
Figure 5.
Dp-actin photoactivated in the cytoplasm is efficiently incorporated into the lamellipodium, and the rate of incorporation is dependent on the G-actin pool in the cytoplasm. (A–C) Dp-actin photoactivated in the cytoplasm is incorporated into the lamellipodium. NIE-115 cells were cotransfected with Dp-actin and RacV12 (A); Dp-actin, RacV12, and LIMK1 (B); or Dp-actin, RacV12, LIMK1, and cofilin(S3A) (C). After cell-wide photobleaching, a 14.25- × 2.85-μm rectangular region (white box) was photoactivated, and fluorescence images were acquired every 2 s for 20 s at 37°C using a laser-scanning confocal imaging system to measure the fluorescence decay of Dp-actin (shown in D). The same cells were photobleached, and the same rectangular region was again photoactivated. Fluorescence images were acquired every 5 s for 40 s to measure the incorporation of Dp-actin into the tip of the lamellipodium (A–C; see Video 5, available at http://www.jcb.org/cgi/content/full/jcb.200610005/DC1). Bar, 20 μm. (D) Time course of the fluorescence decay of Dp-actin in the photoactivated region. Plasmids transfected into the cells are indicated on the right. (E) The rate of Dp-actin incorporation into the lamellipodium, measured as the distance of Dp-actin fluorescence advanced from the tip of the lamellipodium toward the cytoplasm for 20 or 40 s after photoactivation. Data in D and E are means ± SEM of 36 (Dp-actin), 20 (Dp-actin; LIMK1[WT]), 33 (Dp-actin; LIMK1[WT]; cofilin[S3A]), 26 (Dp-actin; LIMK1[WT]; cofilin[WT]), and 23 cells (Dp-actin; LIMK1[WT]; cofilin[S3E]). *, P < 0.05, compared with cells expressing LIMK1(WT) alone. (F) The correlation between the fluorescence decay of Dp-actin at 2 s after photoactivation and the rate of Dp-actin incorporation into the lamellipodium. Each point represents an individual cell transfected with the plasmids indicated in D.

