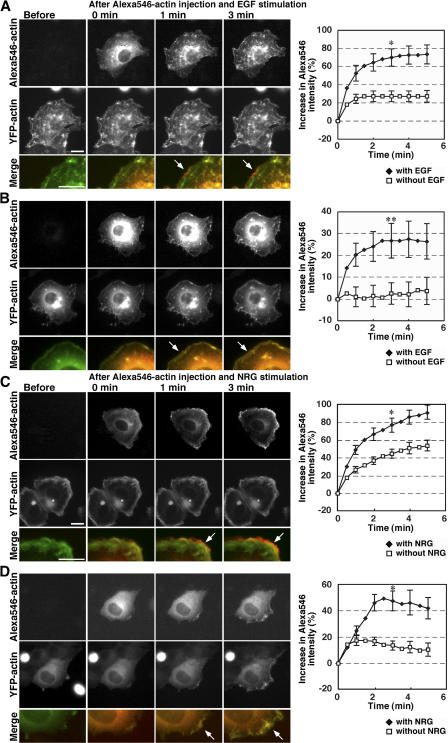
Figure 8.
Microinjected actin monomers are incorporated at the cell periphery after cell stimulation in both cofilin-active and -inactive cells. COS7 cells were cotransfected with YFP-actin and LIMK1(WT) (A) or LIMK1(D460A) (B). MCF-7 cells were cotransfected with YFP-actin and cofilin/ADF siRNA (C) or control siRNA (D). Cells were microinjected with 24 μM Alexa546-actin monomers. Immediately after microinjection, cells were treated with EGF (A and B) or NRG (C and D) or left untreated (see Fig. S4, available at http://www.jcb.org/cgi/content/full/jcb.200610005/DC1), and fluorescence images of Alexa546-actin and YFP-actin were acquired every 30 s for 9.5 min at 30°C using fluorescence microscopy. Merged images of Alexa546-actin (red) and YFP-actin (green) are shown in the bottom panels. Arrows indicate stimulus-induced Alexa546-actin incorporation at the cell periphery. See Videos 7 A, 8 A, 9 A, and 10 A. The graphs at the right quantify the Alexa546-actin incorporation into the cell periphery over time, measured as the percentage of increase in fluorescence intensity of Alexa546-actin in a region 2 μm interior to the cell edge, using ImageJ, with the mean fluorescence intensity at Alexa546-actin microinjection at time 0 normalized to 100%. Data are means ± SEM of 19 (LIMK1[WT] with EGF), 23 (LIMK1[WT] without EGF), 19 (LIMK1[D460A] with EGF), 14 (LIMK1[D460A] without EGF), 16 (cofilin/ADF siRNA with NRG), 18 (cofilin/ADF siRNA without NRG), 11 (control siRNA with NRG), and 14 cells (control siRNA without NRG). *, P < 0.05; **, P < 0.1, compared with unstimulated cells. Bars, 20 μm.

