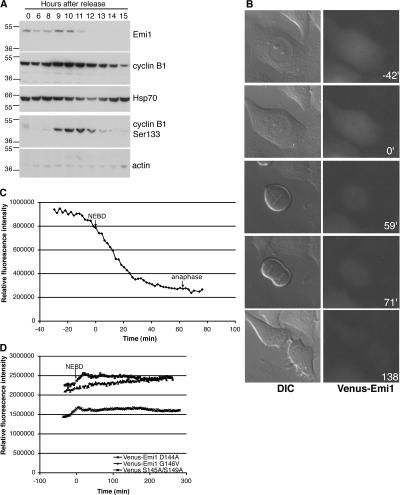
Figure 1.
Emi1 is degraded in prophase. (A) Emi1 levels were analyzed by Western blotting in extracts from HeLa cells synchronized at the G1/S transition by thymidine/aphidicolin block and then released and followed through S and G2 phases and mitosis. Cyclin B1 levels were also analyzed. Anti–cyclin B1 S133 phosphospecific antibody was used as a read-out of Plk1 activity. Hsp70 and actin were used as loading controls. Molecular mass markers (given in kilodaltons) are shown. (B) HeLa cells injected with Emi1 were followed by video microscopy through G2 phase and mitosis. The DIC images were used to determine the different phases and mitotic stages. Time (given in minutes) is shown taking NEBD as t = 0. In general, cells expressing ectopic Emi1 took slightly longer to complete mitosis than control cells. (C) Quantification of fluorescence levels of the cell shown in B. Time of NEBD and anaphase are indicated. Representative of 39 cells from 11 experiments. (D) Two different mutants in the β-TrCP recognition site (D144A and G146V) and the S145A/S149A phosphorylation site mutant are stable after injection in HeLa cells. Representative of 43 cells from 10 experiments for D144A mutant, 44 cells from eight experiments for G146V mutant, and 30 cells from five experiments for the S145A/S149A mutant.

