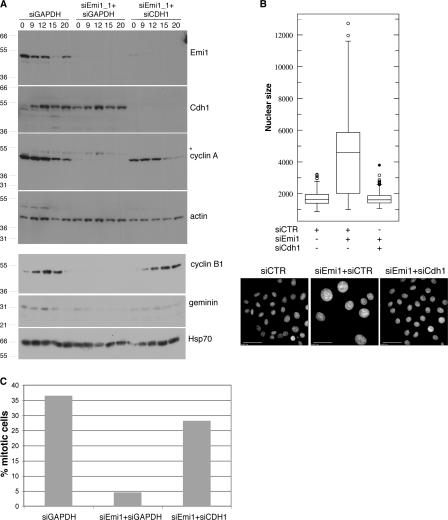
Figure 7.
Rereplication induced by Emi1 down-regulation depends on Cdh1 activity. (A) Thymidine/aphidicolin-synchronized HeLa cells were transfected during release from the thymidine block with the indicated combinations of siRNA oligonucleotides directed against glyceraldehyde-3-phosphate dehydrogenase (negative control), Emi1, and Cdh1. Protein levels were analyzed at the indicated times after aphidicolin release. Actin is shown as a loading control. The asterisk denotes residual Cdh1 signal. (B) Asynchronous HeLa cells were transfected with siRNA oligonucleotides as indicated. 72 h after transfection, cells were fixed, and DNA was stained with Hoechst 33342. The nuclear size was measured and plotted as in Fig. 5 D. 200–300 nuclei were quantified for each sample. The small bars in the dot plot show the minimum and maximum values, and the box shows the first and third quartiles. The bar in the box is the median value. Outliers (closed circles) and suspected outliers (open circles) as determined by statistical analysis are shown. (C) Cells were synchronized and transfected as in A, taxol was added 10 h after release from aphidicolin, and mitotic figures were scored 10 h later as a measure of mitotic entry. About 1,500 cells were analyzed for each sample. (A–C) Representative of two experiments. Bars, 30 μm.

