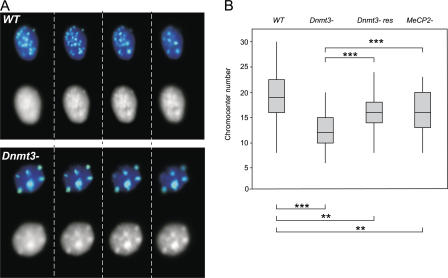
Figure 2.
Chromocenter clustering in the nuclei of mutant ES cells. (A) Single-image planes taken at 1-μm intervals through (left to right) the z axis of WT (top) and Dnmt3 − (bottom) ES cells hybridized with a major satellite probe (green). Nuclei are counterstained with DAPI (blue in color image and shown in black and white below that). (B) Box plots showing the number of distinct chromocenters in the nuclei of WT, Dnmt3 −, Dnmt3 −res, and MeCP2 − ES cells. The lower and upper limits of the boxes denote the 25th and 75th percentiles, respectively, and the line in the box is the median. Statistical comparisons of chromocenter number was performed by Mann-Whitney U test (**, P = 0.001; ***, P = 0.0000).

