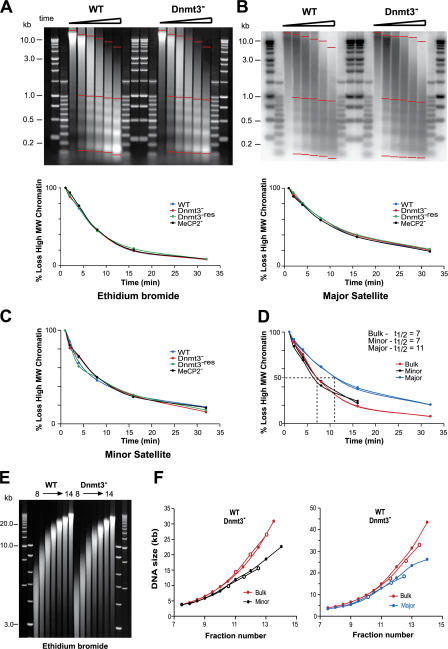
Figure 3.
Sensitivity and compaction of Mnase-digested chromatin from WT and mutant cells. (A and B) EtBr-stained gel (A) and Southern blot probed for major satellite (B) of DNAs prepared from nuclei of WT and Dnmt3 − cells after an Mnase digestion time course. Markers are 1-kb and 100-bp ladders. The percent loss of high molecular weight signal for bulk (A) or major satellite (B) DNAs, which was calculated by measuring the signal between the two top red bars and the total signal between the top and bottom red bars, is graphed below each gel. (C) Percent loss of high molecular weight signal for minor satellite. (D) Percent loss of high molecular weight material signal in WT and Dnmt3 − cells for bulk chromatin (EtBr; red) and minor (black) and major (blue) satellites. (E) EtBr-stained gel of DNA prepared from WT and Dnmt3 − chromatin fractionated on a sucrose gradient. (F) The DNA size of the peak EtBr signals (red) and the minor (black) or major satellite (blue) signals detected after the Southern blotting of E was measured for the WT (closed circles) and mutant (open circles) ES cell chromatins and plotted against fraction number (sedimentation rate).

