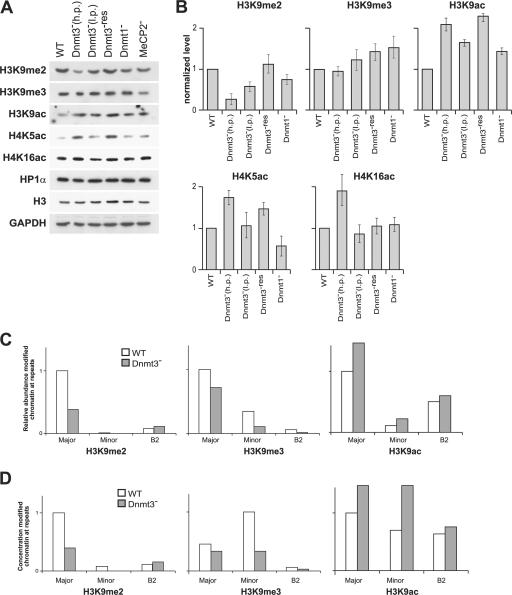
Figure 4.
Histone methylation and acetylation levels in mutant ES cells. (A) Western blots of proteins from WT, Dnmt3 −, Dnmt3 −res, Dnmt1 −, and MeCP2 − ES cells incubated with antibodies that detect H3K9me2, H3K9me3, H3K9ac, H4K5ac, H4K16ac, HP1α, and H3. GAPDH is shown as a control. (B) Mean (±SEM [error bars]) levels of histone modifications detected in the different mutant ES cells normalized relative to GAPDH and WT (n = 3 or 4). (C and D) Abundance (C) and concentration (per kilobase; D) of H3K9me2, H3K9me3, and H3K9ac modifications detected by ChIP at different repeats in WT (white bars) and Dnmt3 − (gray bars) cells. h.p., high passage; l.p., low passage.

