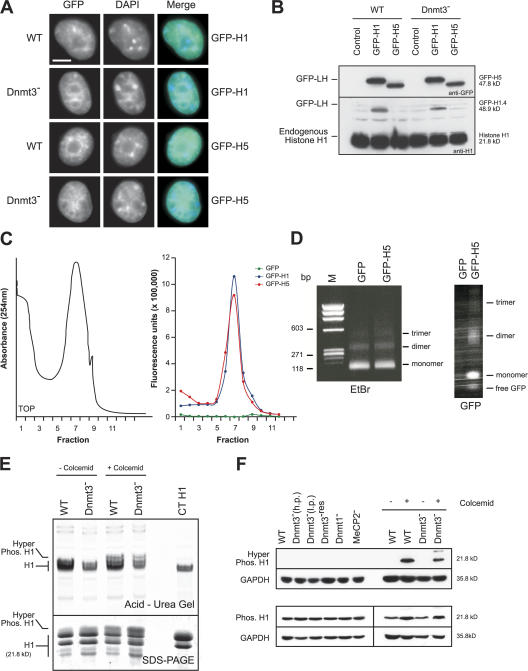
Figure 5.
GFP-tagged linker histone characterization. (A) Distribution of GFP fluorescence (green) in WT or Dnmt3 − ES cells transiently transfected with GFP-H1 or -H5. DNA is counterstained with DAPI (blue). Bar, 5 μm. (B) Western blot of nuclei prepared from GFP-H1– or -H5–transfected WT and Dnmt3 − cells probed with an anti-GFP or -H1 antibody; the position of the GFP-tagged linker histone (GFP-LH) and endogenous H1 are indicated. Transfection efficiency is ∼30%. (C) Chromatin isolated from Dnmt3 − cells transfected with GFP–linker histone or free GFP and fractionated on a 10/ 50% sucrose step gradient. Chromatin was monitored by absorbance at 254 nm (left). GFP fluorescence was monitored across the fractions at 507 nm (right). (D) EtBr-stained 1% agarose gel of DNA purified from Mnase-digested chromatin from cells transfected with GFP or GFP-H5 (left). Chromatin was fractionated on a native nucleoprotein gel and scanned for GFP fluorescence (right). M, marker. (E) Coomassie-stained acid-urea (top) or SDS-PAGE (bottom) gels of perchloric acid–extracted linker histones from WT and Dnmt3 − cells. (F) Western blot with antibodies detecting phosphorylated or hyperphosphorylated H1 on protein extracts from WT and mutant ES cells in the presence or absence of colcemid treatment. GAPDH was used as a loading control.

