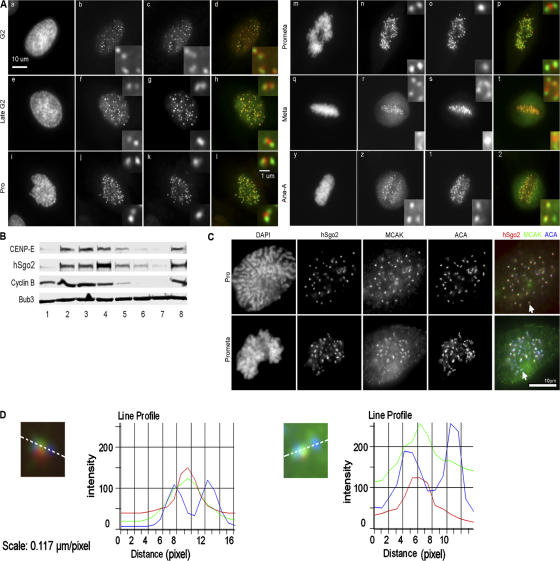
Figure 1.
hSgo2 localization and expression patterns. (A) HeLa cells released from a double thymidine block were costained with Bub1 (b, f, j, n, r, z) and hSgo2 (c, g, k, o, s, 1). Shown are cells from G2 through anaphase A. Insets show enlarged images of kinetochore pairs. Color images show the merged signals of Bub1 (green) and hSgo2 (red) staining. (B) Western blots of lysates prepared from cells released from a mitotic block. Lane 1, asynchronous cells; lanes 2–7, cells at 0, 30, 60, 90, 120, and 150 min after nocodazole washout; lane 8, cells released into medium with MG132 and harvested at 150 min. Bub3 is used as a loading control. (C) Costaining of hSgo2, MCAK, and ACA in prophase (Pro) and prometaphase (Prometa) HeLa cells. (D) Intensity profiles of hSgo2 (red), MCAK (green), and ACA (blue) of a representative kinetochore (C, arrow) in prophase (left) and prometaphase (right). Intensity values were obtained from the separate channels and plotted as a function of distance (inset, white dotted line). 25 kinetochores with discrete signals in all three channels were measured.

