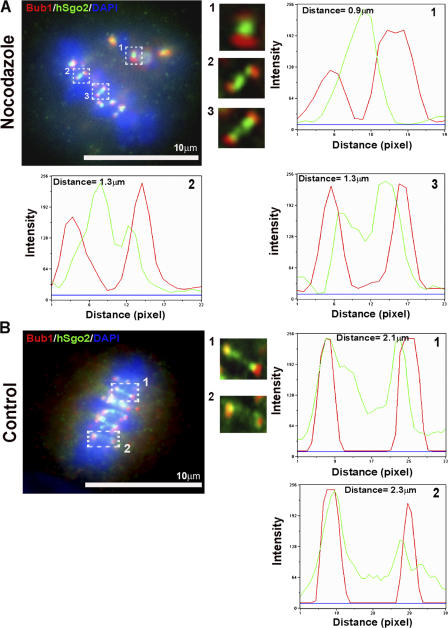
Figure 2.
hSgo2 localization is affected by kinetochore tension. (A) Cells treated with a low-dose nocodazole to suppress microtubule dynamics, and thus reduce tension between bipolar attached kinetochores, were costained with Bub1 (red), hSgo2 (green), and DAPI (blue). Insets depict enlarged images of single kinetochore pairs highlighted by the dashed boxes. 1, unattached kinetochore pair; 2 and 3, bipolar attached kinetochores of aligned chromosomes. (B) Control metaphase cells. 1 and 2, bipolar attached kinetochores under full tension. Distances were measured from the centers of Bub1 and hSgo2 intensity profiles. Scale, 1 pixel = 0.117 μm. All images were captured and processed identically.

