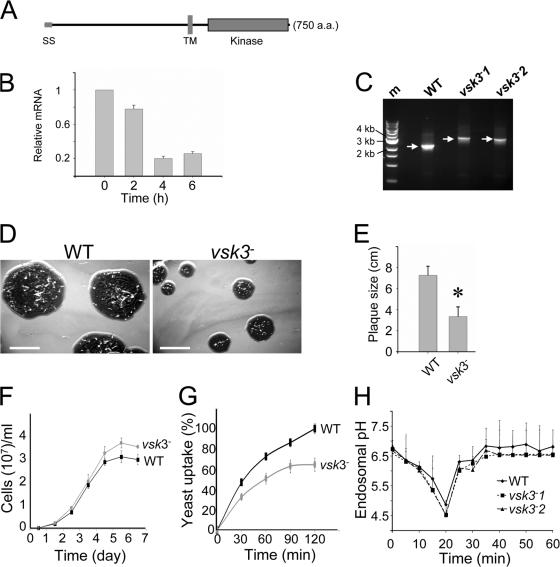
Figure 1.
The predicted structure of VSK3, its expression pattern, and disruption are shown. (A) A schematic depiction of the VSK3 protein is shown, highlighting a signal sequence, SS, an N-terminal domain, a transmembrane domain, TM, and a C-terminal kinase domain. (B) The vsk3 mRNA levels decrease during development. Total mRNA was harvested from growing cells (0) and from cells developed in nonnutrient DB buffer with cAMP pulses for 2, 4, and 6 h and vsk3 mRNA levels were assessed by real-time PCR. (C) The predicted molecular weight increase of PCR products from genomic DNA of two vsk3 − clones relative to WT is shown. A marker lane (M) shows the 1-Kb DNA ladder. (D) Clonal plaques of WT and vsk3 − cells on bacterial lawns are shown. Bars: 5 cm. (E) The diameter of individual plaques formed by WT and vsk3 − cells were measured 6 d after cells were plated on bacterial lawns. Means and SD are shown (n = 20). A t-test indicated a statistically significant difference (*, P < 0.01). (F) Growth rates of WT and vsk3 − cells in D3T media are shown. (G) Cells fed TRITC-labeled, heated killed yeast were treated with Trypan blue and processed for fluorometric analysis at the indicated time points to measure phagocytosis rates. Fluorescence intensities were normalized to the maximal value of WT cells. Each measurement was done in triplicate and the experiment was performed three times. The mean and SD are shown from one experiment. (H) WT and the two indicated vsk3 − strains were allowed to take up FITC-dextran by pinocytosis. After washing, FITC fluorescence was measured in aliquots of total cells at the indicated time points by fluorometry.

