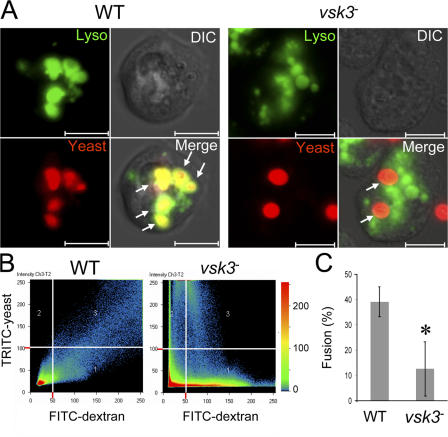
Figure 8.
Phagosome–lysosome fusion in wild-type (WT) and vsk3− cells. (A) WT and vsk3 − cells were incubated with FITC-dextran (green) for 3 h to label lysosomes and were fed Texas red–labeled, heated killed yeast (red). After washing away uningested yeast, cells were imaged for lysosomes, yeast and DIC using confocal microscopy. Merged images show colocalization of yeast and FITC-dextran in WT but not in vsk3 − cells. Bars: 10 μm. (B) Quantitative analysis of colocalization of FITC-dextran and Texas red–yeast images as a scatter diagram (LSM 510META software; Carl Zeiss MicroImaging, Inc.). The scatter diagram shows three fluorescence positive regions: region 1: FITC positive and Texas red negative; region 2: FITC negative and Texas red positive; and region 3: FITC and Texas red positive. In region 3, FITC-dextran and Texas red–yeast display a high degree of colocalization in WT but not vsk3 − cells. The color bar shows colocalization frequency between the two channels. (C) Phagosome– lysosome fusion is significantly reduced in vsk3 − cells. Lysosomes were prelabeled with FITC-dextran in WT and vsk3 − cells and cells were fed Texas red–labeled yeast as in (A). 100 cells with internalized yeast were imaged by confocal microscopy and the percentage of intracellular yeast that colocalized with FITC-dextran was calculated and expressed as mean and SD for six independent experiments. Asterisk indicates a significant difference relative to WT (P < 0.01).

