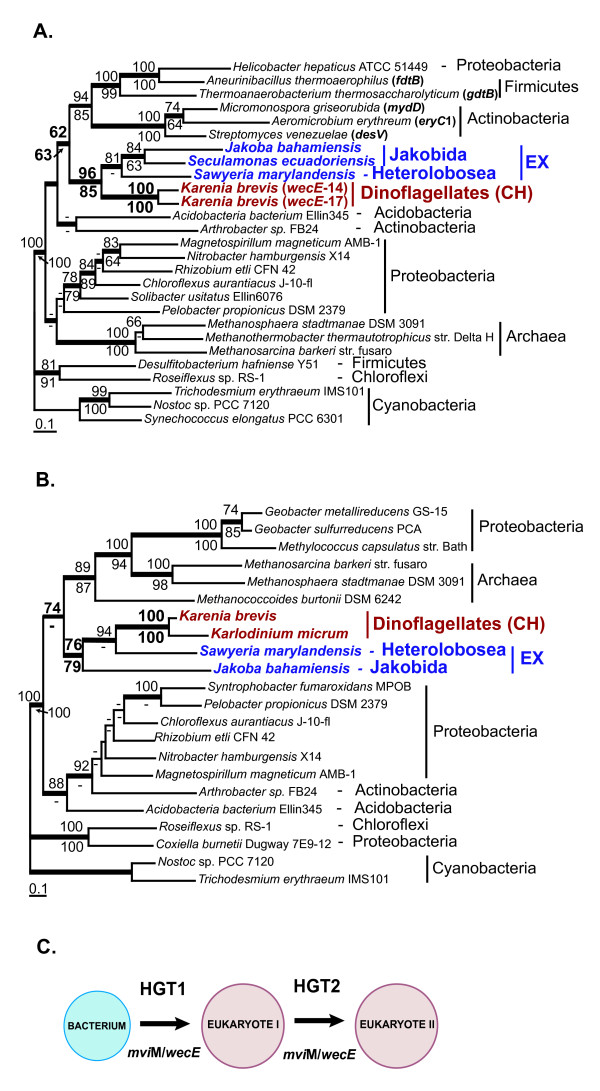
Figure 2.
Origin of sugar aminotransferase WECE and dehydrogenase MVIM in eukaryotes. A. ML tree of sugar aminotransferase WECE. B. ML tree of dehydrogenase MVIM. The numbers above and below the branches are the results of ML and NJ bootstrap analyses, respectively. Only bootstrap values ≥ 60% are shown. The thick branches indicate ≥ 0.95 posterior probability from a Bayesian inference. Branch lengths are proportional to the number of substitutions per site (see scale bars). Numbers in bold indicate bootstrap support for the monophyly of wecE-14 and wecE-17 sequences in Karenia brevis. CH indicates chromalveolates and EX indicates Excavata. Names of bacterial WECE-encoding genes that have been studied experimentally [34-36, 41, 43] are given in brackets. C. Origin and distribution of MVIM and WECE in eukaryotes through sequential HGTs.

