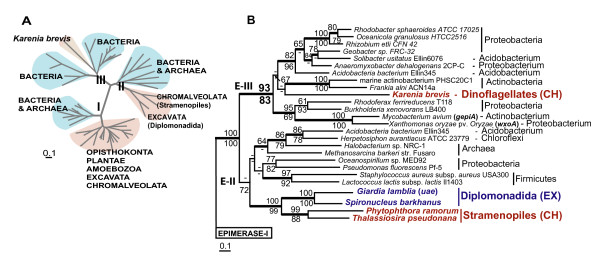
Figure 3.
Phylogeny of NAD-dependent sugar nucleotide epimerase/dehydratase isoforms. A. ML tree of three isoforms of NAD dependent sugar nucleotide epimerase/dehydratase. Light brown color represents eukaryotic clades; blue color represents prokaryotic clades.B. A fragment of the ML tree from the Figure 3A representing the phylogeny of NAD dependent sugar nucleotide epimerase/dehydratase isoforms II (E-II) and III (E-III). The numbers above and below the branches are the results of ML and NJ bootstrap analyses, respectively. Only bootstrap values ≥ 60% are shown. The thick branches indicate ≥ 0.95 posterior probability from a Bayesian inference. Branch lengths are proportional to the number of substitutions per site (see the scale bar). CH indicates chromalveolates and EX indicates Excavata. Names of the epimerase-encoding genes that have been studied experimentally [44, 45, 47] are given in brackets.

