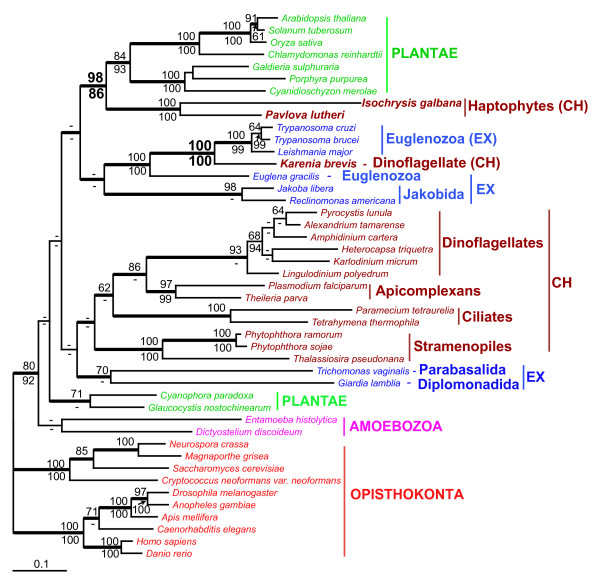
Figure 7.
Phylogeny of translation elongation factor 2 (EF2) in eukaryotes. ML tree of EF2. The numbers above and below the branches are the results of ML and NJ bootstrap analyses, respectively. Only bootstrap values ≥ 60% are shown. The thick branches indicate ≥ 0.95 posterior probability from a Bayesian inference. Branch lengths are proportional to the number of substitutions per site (see the scale bar). CH indicates chromalveolates and EX indicates Excavata.

