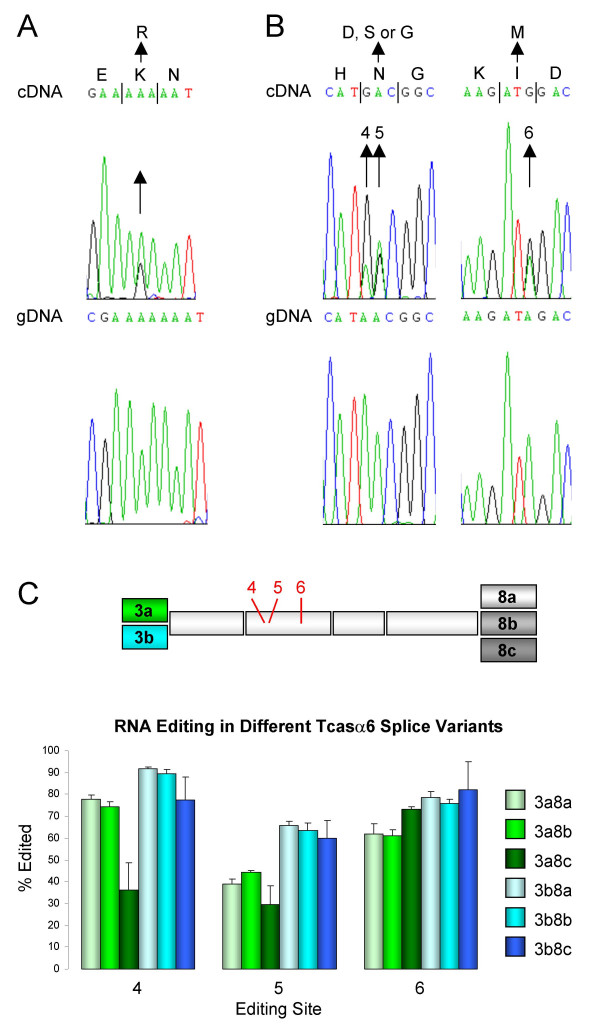
Figure 7.
RNA A-to-I editing in T. castaneum cys-loop LGIC subunits. Arrows highlight the mixed adenosine/guanosine peak in the cDNA sequence indicating RNA editing as well as the resulting amino acid change. The corresponding genomic DNA (gDNA) sequence, which lacks this mixed A/G signal, is also shown. (A) RNA editing of Tcasβ1. (B) RNA editing of Tcasα6. Editing sites 4, 5 and 6 [37] are indicated. (C) A schematic of exons 3–8 of Tcasα6 with editing sites 4–6 (indicated in red) is shown. The graph shows mean RNA editing levels (n = 4) at sites 4–6 in different splice variants. Error bars indicate standard deviation.

