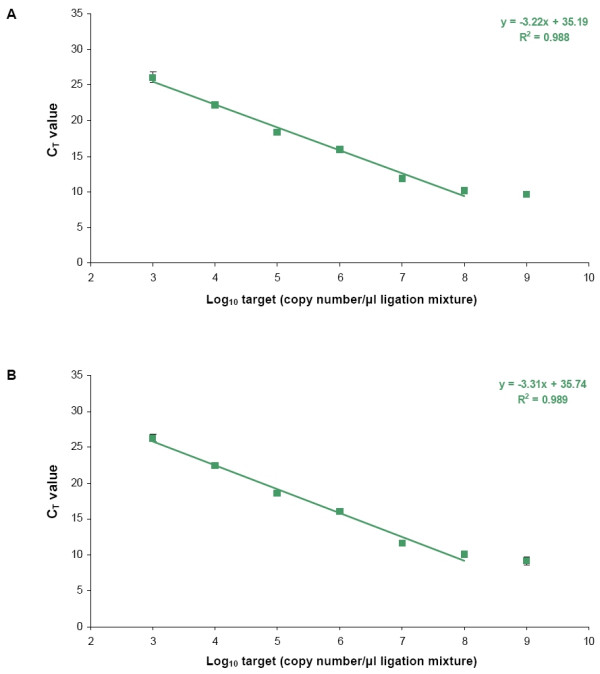
Figure 3.

Calibration curves to assess the reproducibility of the Biotrove OpenArray™ platform and the PRI-lock system. (A) Inter-array variation: The PRI-lock probe mixture was ligated on a 10-fold serial dilution of P. infestans target and amplified on the Biotrove OpenArray™ platform. Samples were tested on three different OpenArrays™ (n = 3). Data represent averages of six PCR replicates (n = 6). The error bars represent the standard deviations. (B) Assay-to-assay reproducibility: Three separate whole assay repeats ligation reactions were performed on 10-fold serial dilution of P. infestans target and amplified in the Biotrove OpenArray™ platform. Data represent averages of 3 separate ligation experiments (n = 3) with each, four PCR replicates (n = 4). CT values were normalized using the ILC PRI-lock probe. The error bars represent the standard deviations (Sometimes the standard deviation error bars fall within the data squares).
