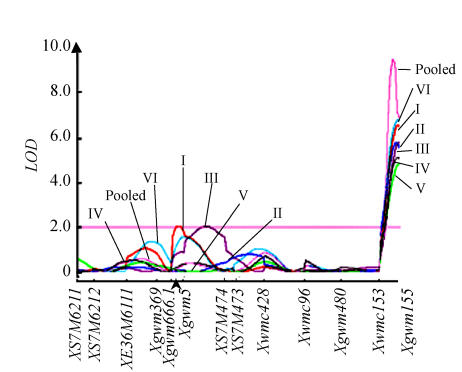
Fig. 1.
A QTL Cartographer plot for chromosome 3A obtained following composite interval mapping (CIM) for pre-harvest sprouting tolerance (PHST) in population PIII for six different environments (I~VI) and the pooled data
Marker designations are given at the bottom of the horizontal line; arrow indicates centromere [modified from Kulwal et al.(2005b)]

