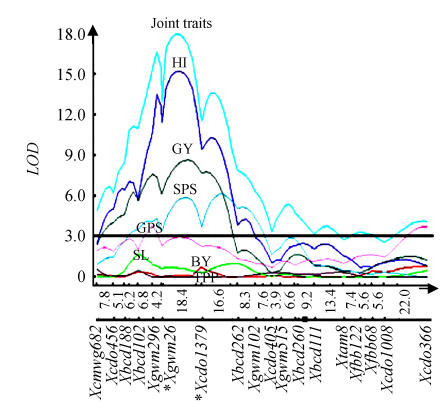
Fig. 2.
QTL Cartographer plot for chromosome arm 2DS obtained using MCIM and joint MCIM involving seven yield traits in PII. The plot shows a pleiotropic QTL on chromosome arm 2DS
Marker designations are given below and the genetic distances (cM) are given above the horizontal line. Solid black rectangle indicates centromere; asterisks (*) indicate flanking markers of the QTL. Trait abbreviations are on peaks of curves (HI: Harvest index; GY: Grain yield; SPS: Spike lets per spike; GPS: Grains per spike; SL: Spike length; BY: Biological yield; TPP: Tiller per plant) [modified from Kumar et al.(2007)]

