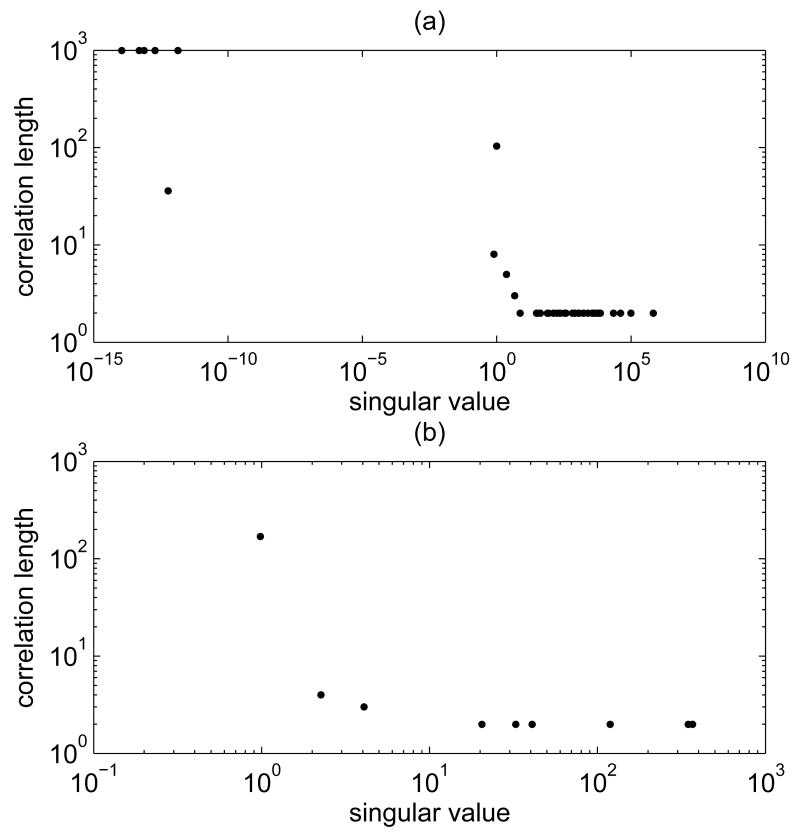
Fig. 4.
Singular values and correlation lengths for (a) the whole model and (b) the minimal model sampler. The values are based on samples with 200 000 elements. The correlation length was calculated as explained in Section 4.1, using a value ℓ = 1000 for the maximum value of the correlation length.

