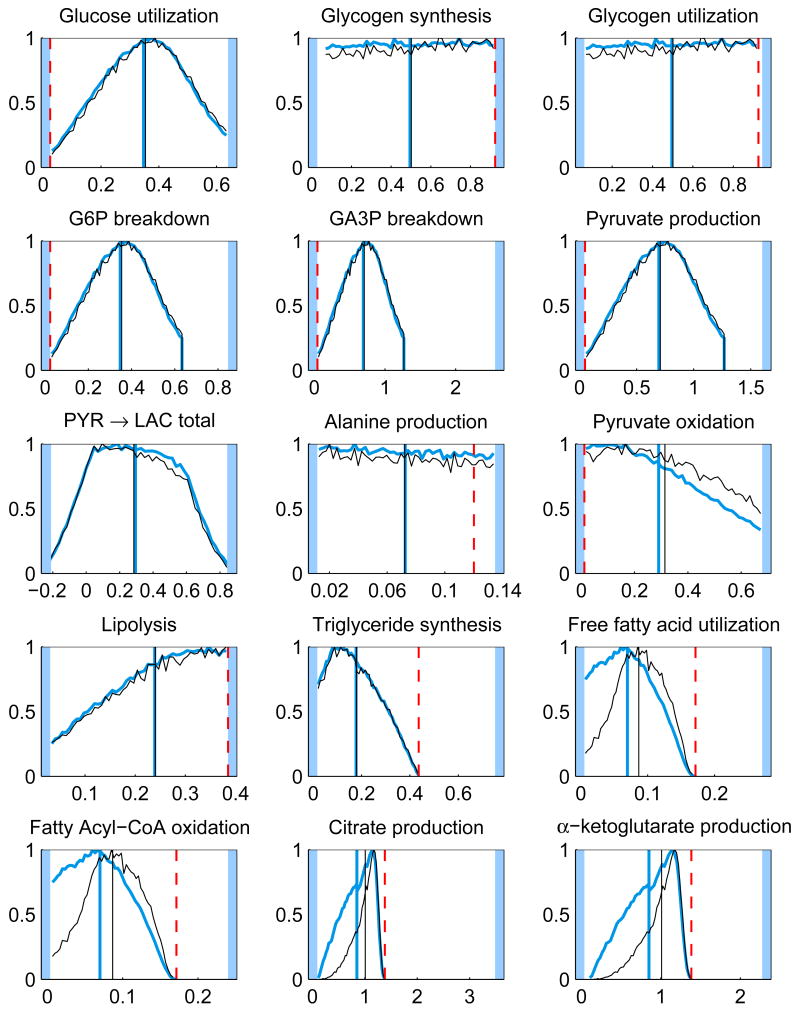
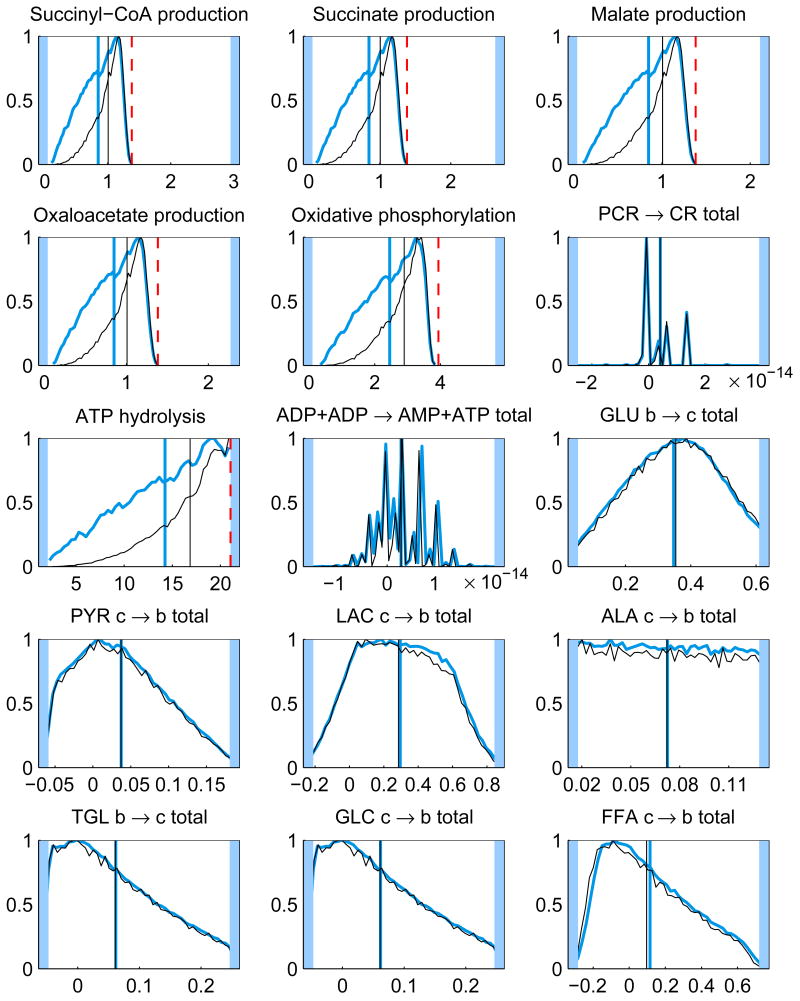
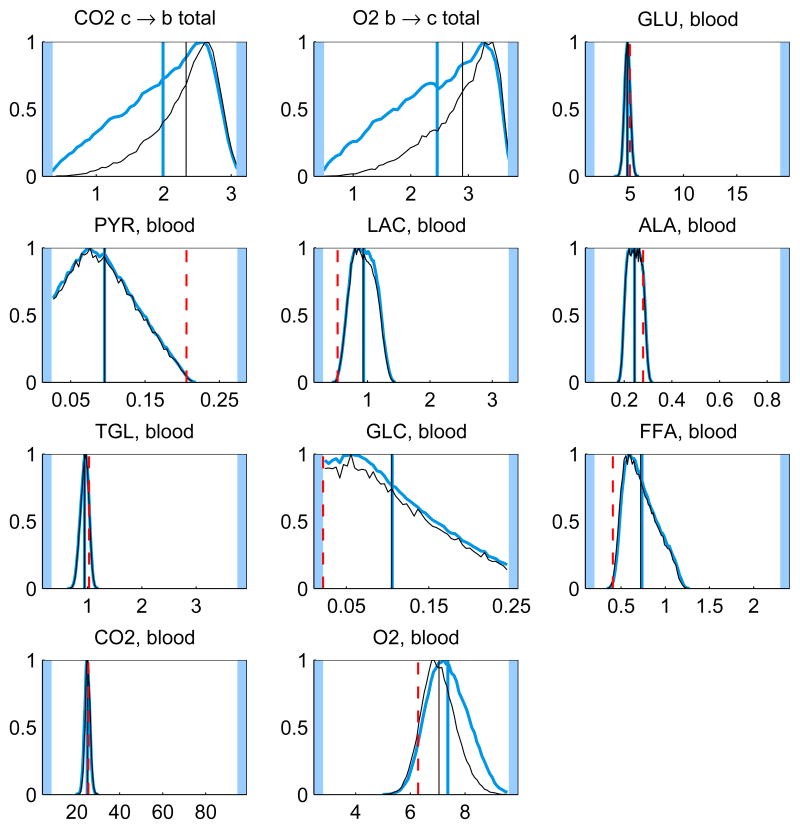
Fig. 7.
The histograms and the corresponding CM estimates of all the components of the solution u from Gibbs sampling using the minimal model before (thicker blue) and after (thinner black) applying rejection sampling. For reversible reactions and transport fluxes, the net flux is plotted. The maximum of each histogram is normalized to unity. The units for the reaction and transport fluxes are mmol/min and for the concentrations mmol/l. The LP solution (dashed red) is also depicted (except for net fluxes). The highlighted area in the plots defines the bounds, or in case of net fluxes, the span of the histogram.


