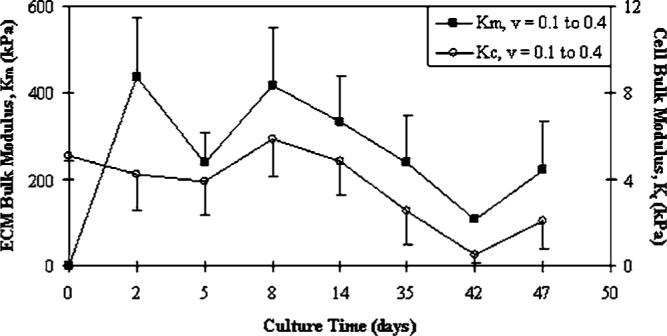
Fig. 6.

Variation of cell (p=0.0067) and ECM (p=0.0748) constituent bulk moduli over time. Comparison of Poisson ratio variability (νconstruct=0.1 or 0.4) on cell and ECM bulk moduli as calculated from Eqs. (8) and (9)(mean values, Km+SE and Kc−SE). The ECM modulus is statistically greater than the cell modulus at all analyzed values of νconstruct (p<0.05). Note, Km=0 at t=0 indicates that ECM was not present at cell seeding.
