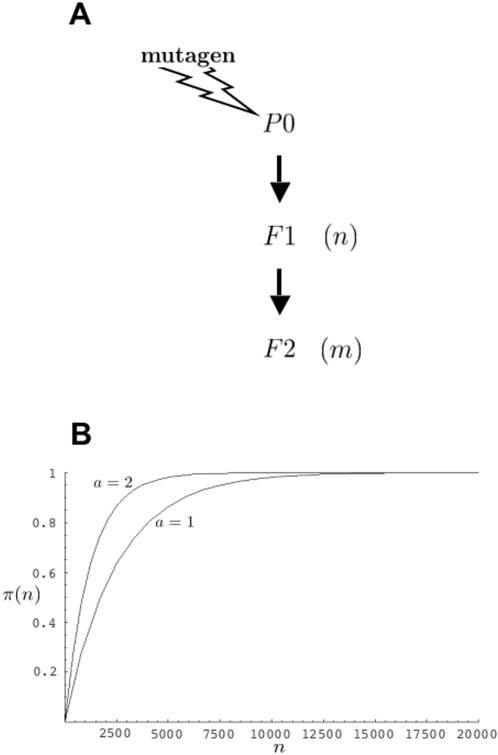
Figure 1. General genetic screening scheme in C. elegans.
(A) P0 animals are mutagenized, and allowed to self-fertilize to produce F1 animals. To identify recessive mutations, F1 animals are allowed to self-fertilize to produce the F2 generation. In this paper we consider the case of n F1 animals giving rise to m F2 animals. (B) Plots describing the probability, π(n), that among n F1 animals screened, following mutagenesis by EMS (r = 1,250), will be found at least one F1 animal heterozygous for a loss-of-function mutation in a gene of interest. The parameter a is as defined in the text. The plots were generated by the program Mathematica 5.0 (Wolfram Research), using n as a continuous variable.

