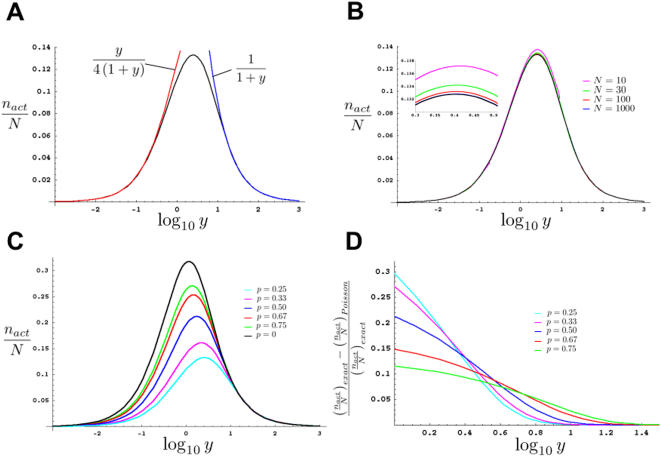
Figure 2. The effects of different parameters on the number of haploid genomes screened.
(A–C) Plots assuming all F1 animals are placed together on a single plate. p = 0.75, unless otherwise indicated. All plots were generated using the program Mathematica 5.0 (Wolfram Research). (A) Black line, graph of nact/N vs. log10 y for N = 1,000. Blue and red lines, graphs of asymptotes and their equations. (B) Graphs of nact/N vs. log10 y. Different colors indicate nact/N for different specified values of N. Black line, Poisson approximation, colored lines, exact solutions. Inset, magnification of the graph for the region of log10 y between 0.3 and 0.5. For each value of N, y can only take on values such that 1/(N−1)≤y≤N−1. Furthermore, although for illustration purposes we have drawn the curves as continuous, y is not a continuous variable, and treating it as such only works for large N. This is most obvious for N = 10 where y can only take on the values 1/9, 1/4, 3/7, 2/3, 1, 3/2, 7/3, 4, and 9. (C) Graphs of nact/N vs. log10 y for varying values of p, as defined in the text. Graphed using the Poisson approximation. (D) Graphs depicting the fractional error incurred when using the Poisson approximation to estimate nact/N for screens in which one F1 animal is plated per plate. Although graphs are continuous, only integer values of y are relevant. Also note that the smallest allowable value of y is chosen so that at least 1 F2 animal is chosen per plate.

