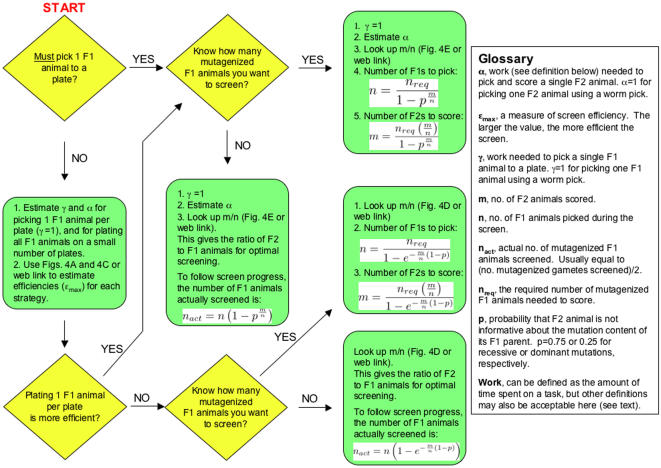
Figure 5. Algorithm for performing an optimal genetic screen.
Flowchart begins on the top left corner at “START”. All parameters and equations are described and derived in the text. Parameters of relevance are also described in the Glossary portion of the figure. Diamond shapes indicate steps where a choice must be made.

