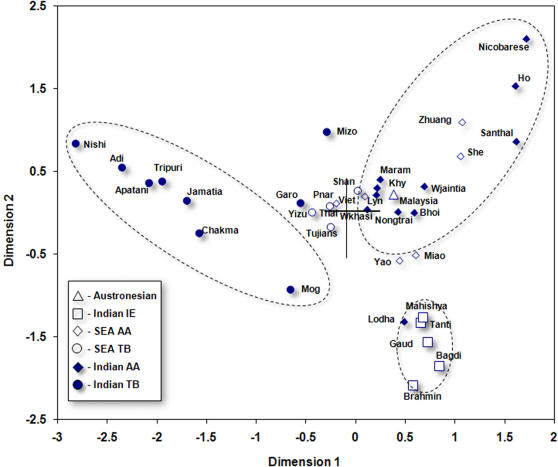
Figure 3. Plot on the first two dimensions derived from the multidimensional scaling of the pairwise FST distances of the populations based on Y-haplogroups.
Reference to comparative data is given at Table 5. SEA, Southeast Asian; AA, Austro-Asiatic; IE, Indo-European, TB, Tibeto-Burman; Khy, Khynriam; Lyn, Lyngngam; Wkhasi, War Khasi; Viet, Vietnamese;

