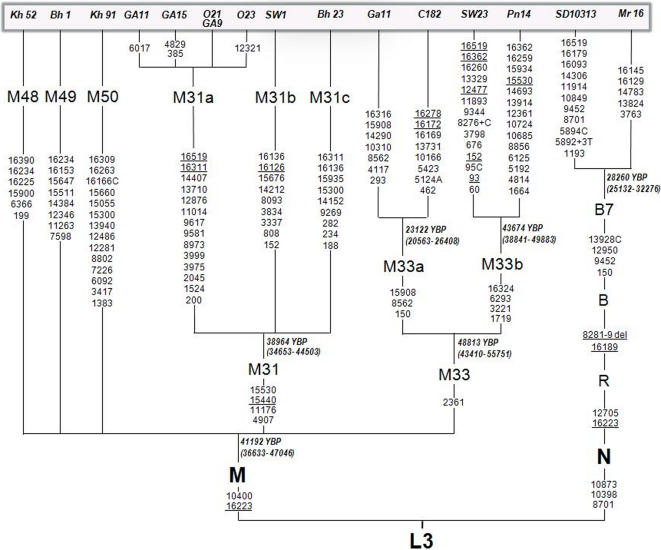
Figure 4. Phylogenetic tree of new haplogroups based on full mtDNA along with the TMRCA and associated 95% Confidence Interval.
The samples names are on the tip of the haplogroups. The comparative data, for which sample names are written in capital letters, are from Kong et al. [17], Thangaraj et al. [3], Sun et al. [16] and Palanichamy et al. [19].

