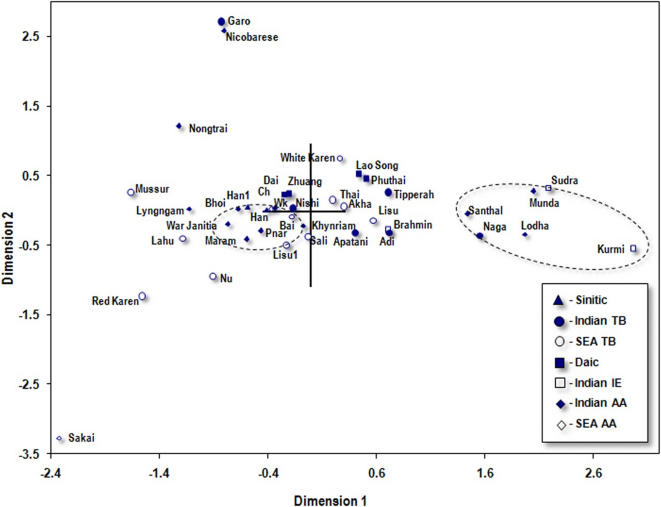
Figure 6. Plot on the first two dimensions derived from the multidimensional scaling of the pairwise FST distances of the populations based on mtDNA haplogroups.
Reference to comparative data is given at Table 6. SEA, Southeast Asian; AA, Austro-Asiatic; IE, Indo-European; TB, Tibeto-Burman; Wk, WarKhasi; Ch, Chong;

