
Figure 3. Arginase activity in red blood cell lysate vs. plasma.
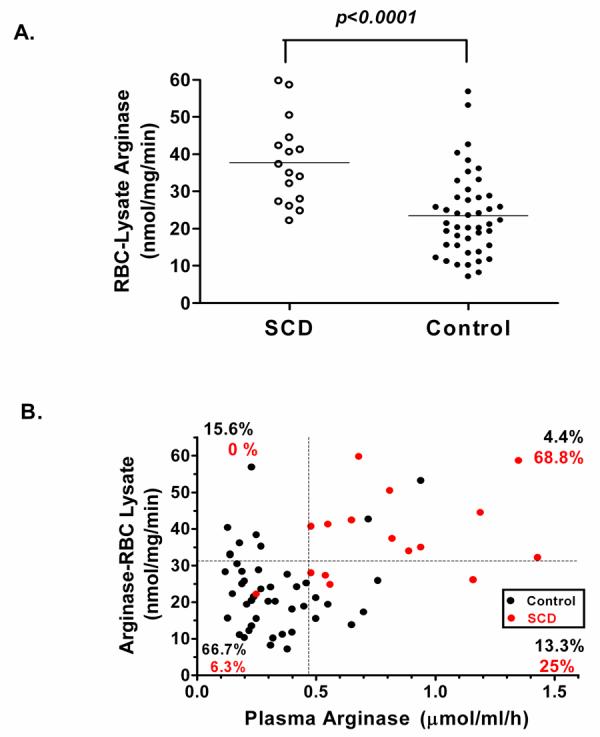
A. Red blood cell (RBC)–lysate arginase activity (nmol/mg/min) in normal controls (Control, n=45) compared to patients with sickle cell disease (SCD, n=16). B. Correlation of plasma arginase to red blood cell-lysate arginase activity in control patients (black circles) and patients with sickle cell disease (red circles; r=0.43, p< 0.001). For purposes of comparison, horizontal and vertical dotted lines are set at approximately the 80th percentile for arginase activities of RBC-lysates and plasma, respectively, for control patients.