Figure 1.
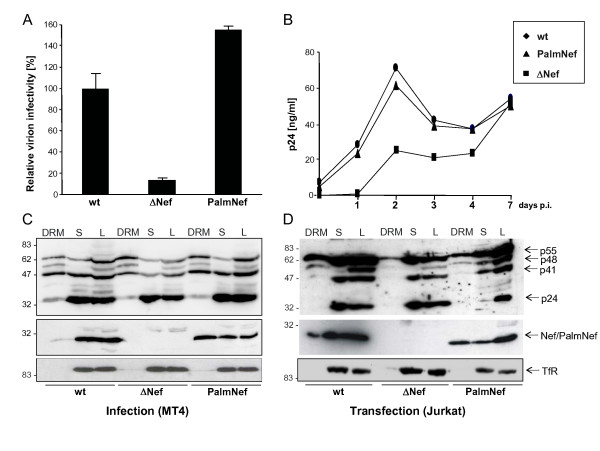
Nef boosts HIV-1 infectivity and replication without increasing microdomain association of Gag in producer cells. (A) Single round of replication analysis on TZM cells. TZM cells were infected with 0.5 ng CA of the indicated virus stocks. 36 hours post infection, the cells were fixed, stained for β-galactosidase activity and the number of blue cells was counted. Data represent average values from three independent experiments with triplicate measurements each with the indicated standard error of the mean. Depicted is the relative virion infectivity (number of blue cells per ng CA) with values for HIV-1NL4-3 NefSF2 (wt) arbitrarily set to 100%. (B) HIV-1 replication in PBL. HIV replication was measured in 96 well plates on 1 × 10⁵ PBL per well and 1 ng CA virus input. Freshly isolated, non-activated cells were infected (day -6) for three days and subsequently activated by PHA/IL-2 for three days. Starting from day 0, cells were kept in the presence of IL-2 and cell culture supernatants were collected each day to monitor CA production. CA values represent the average from quadruplicate infections performed in parallel. (C-D) Lipid raft flotation analysis from infected MT-4 (C) or transfected Jurkat T lymphocytes (D). Cell lysates (1% Triton X-100) were separated by Optiprep gradient ultracentrifugation, and eight fractions were collected from the top (fraction 1) to the bottom (fraction 8) of the gradient. The detergent resistant membrane fraction (DRM, fraction 2) and the pooled nonraft (soluble) fractions (S, fractions 7 and 8) were analyzed together with the unfractionated cell lysate (L) by Western Blotting for the distribution of Gag (top), Nef (middle) and TfR (bottom).

